

AUD/USD Technical Analysis: Bullish Breakout Trigger in View at the Start of Q3
AUD/USD has broken below the sharp uptrend channel from the middle of April, but that break hasn’t meant particularly sharp falls. Instead, the Aussie is back very close to the 0.6618 level at which it started the second quarter back in April.
The pair remains above the medium-term downtrend from the five-month peaks of late December 2023, but is essentially stuck in the broad range between 0.67329 and 0.65731. These are respectively the first and third Fibonacci retracement of the rise to those December highs from the lows of late October. A durable fall below the latter could well flag further weakness for the Aussie, but it doesn’t seem likely in the near term. Indeed, the last fall below that level was quickly traded back out of by Aussie bulls. A move above the weekly candle wick highs around 0.6700 may reveal renewed bullish intent. There’s plenty of trading scope within that range, of course, but without some significant fundamental data shock there seems little prospect of it breaking.
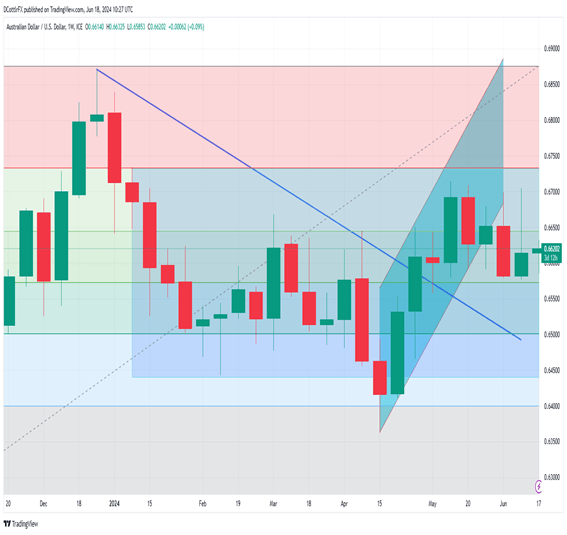
Source: TradingView, Prepared by David Cottle
After acquiring a thorough understanding of the AUD technical landscape in Q3, why not see what the fundamental outlook suggests by downloading the full Australian Dollar Q3 forecast?

Risk Sentiment Propels AUD/JPY to Great Heights as Signs of Fatigue Appear
The AUD/JPY chart is at least superficially more interesting than its AUD/USD counterpart. Fundamentally of course the Yen remains beleaguered across the board despite this year’s historic shift away from the ultra-loose monetary settings which have ruled in Japan for decades. The problem for the Yen is that, while the policy may have changed, monetary action has been extremely gradual and Japanese yields will remain much lower than those of developed market peers for years to come.
AUD/JPY is now back to highs not seen since April 2013 (and they were seen only briefly then). While the cross-rate remains well within the dominant uptrend channel from 2020’s lows, there are signs that the bulls are running out of steam below psychological resistance at 105.00. The market is also a very long way above both its 50- and 200-day moving averages.
While the fate of this cross is likely to closely track events in USD/JPY, the quarter could bring some consolidation below current peak. However, this pair is and will remain closely correlated to overall market risk appetite and, while this holds up, a meaningful reversal will be unlikely.
AUD/JPY Weekly Chart and Analysis
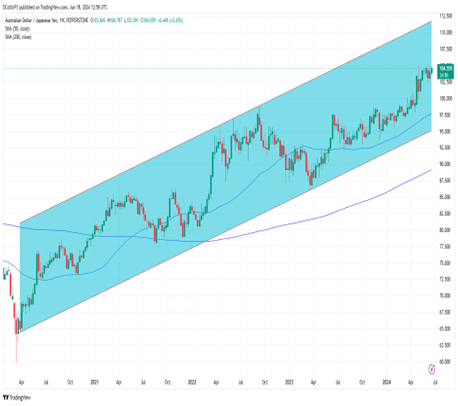
Source: TradingView, Prepared by David Cottle
| Change in | Longs | Shorts | OI |
| Daily | -5% | 1% | 0% |
| Weekly | 8% | 1% | 2% |