


Australian Dollar, AUD/USD, AUD/JPY, Symmetrical Triangle – Technical Update:
- Australian Dollar remains pressured after recent losses
- AUD/USD closed at its lowest since early November
- Meanwhile, AUD/JPY is facing a Symmetrical Triangle

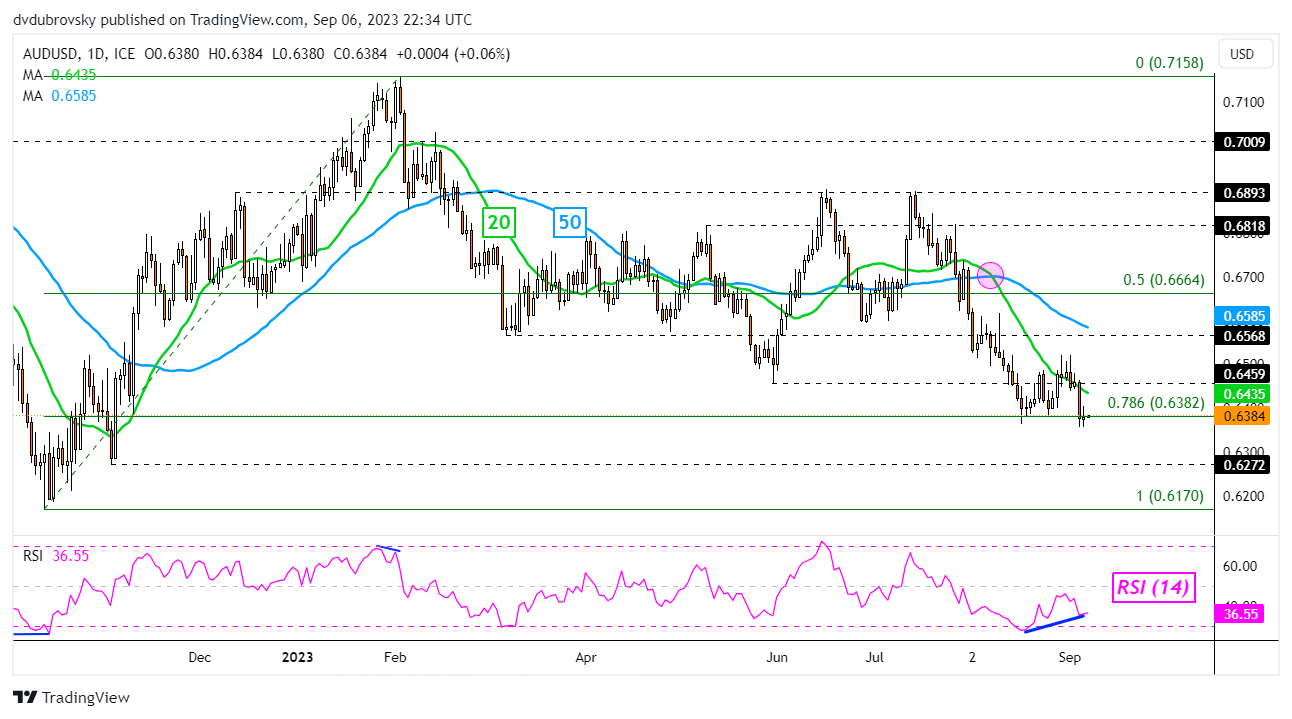
The Australian Dollar closed at its weakest against the US Dollar since early November, opening the door to extending the broader downtrend since the beginning of this year. This is being reinforced by a Bearish Death Cross between the 20- and 50-day Moving Averages (MA) from August, with the former line recently holding as resistance.
But, AUD/USD faces positive RSI divergence. This is a sign of fading downside momentum, which can at times precede a turn higher. Still, in such an outcome, the MA’s could hold as resistance, maintaining the downside technical bias. Otherwise, extending lower places the focus on the November 3rd low of 0.6272 before the 2022 bottom of 0.6170 kicks in.

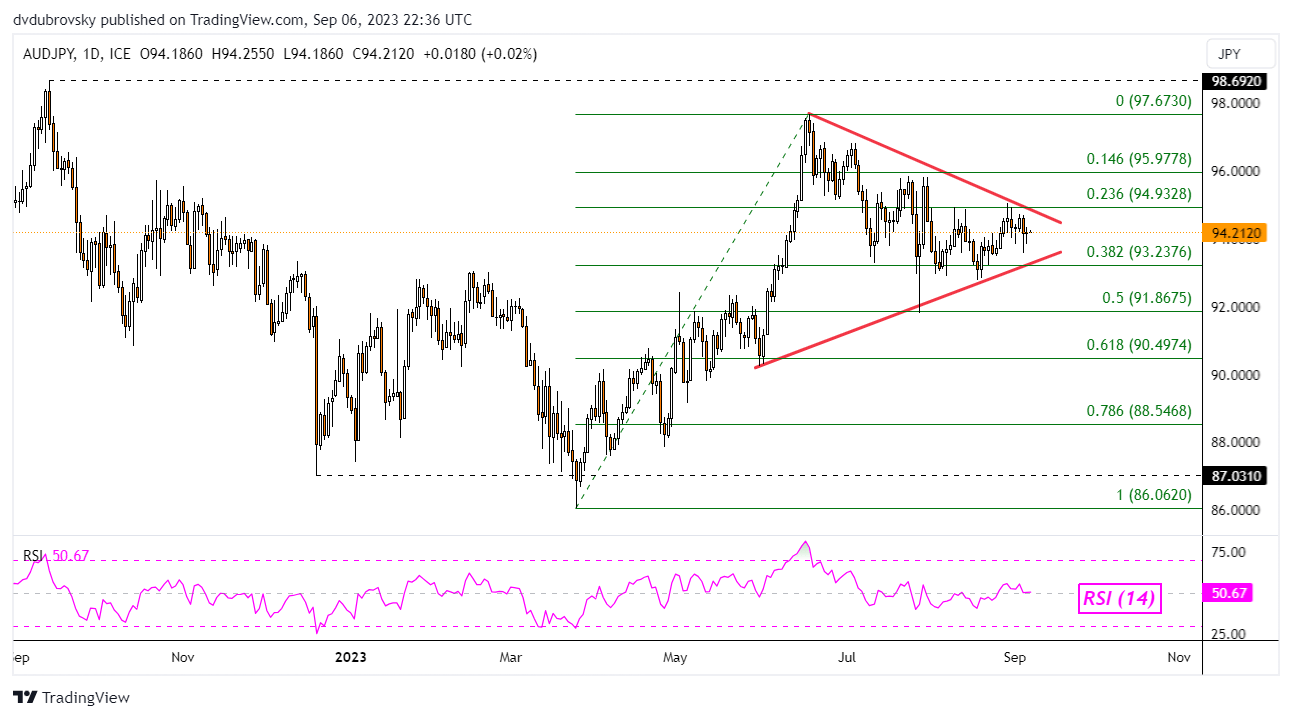
Meanwhile, against the Japanese Yen, the Australian Dollar is facing a different technical situation. A Symmetrical Triangle chart formation has been brewing since earlier this year. Now, AUD/JPY is quickly running out of space to consolidate between rising support and falling resistance. The direction of the breakout could be key for preceding the broader trend.
In the event of an upside breakout, key resistance is the 23.6% Fibonacci retracement level of 94.93. Extending gains could open the door to revisiting the June high of 97.67. Otherwise, key support is the 38.2% level of 93.23. Below the latter sits the midpoint at 91.86. A stronger bearish technical conviction could see the exchange rate drop towards the 61.8% level of 90.49.
| Change in | Longs | Shorts | OI |
| Daily | 9% | 5% | 5% |
| Weekly | 8% | 8% | 8% |
--- Written by Daniel Dubrovsky, Senior Strategist for DailyFX.com


