


British Pound, GBP/USD, Technical Analysis, Retail Trader Positioning – IGCS Update
- British Pound sees the worst 24 hours since late July
- Retail traders have increased upside GBP/USD bets
- Bearish Head & Shoulders chart pattern still in focus

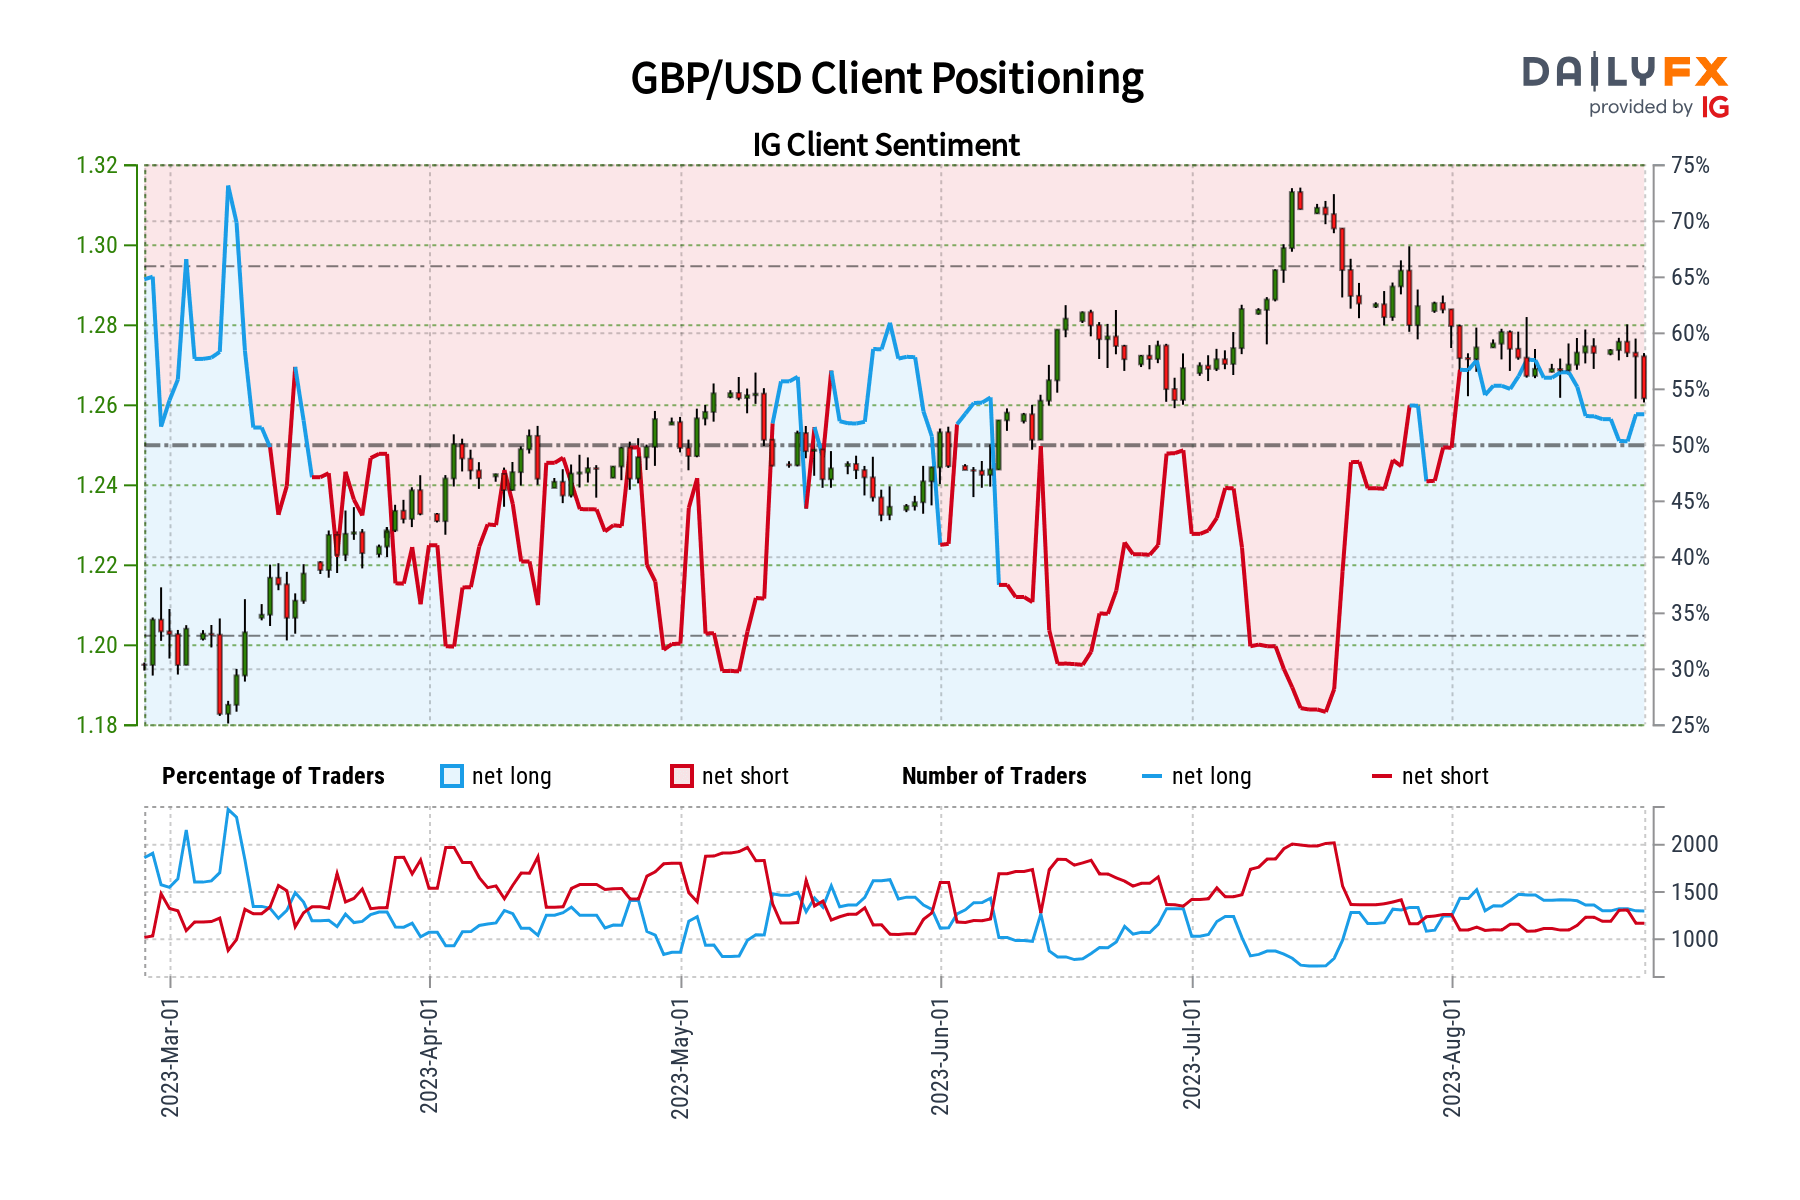
The British Pound closed at its lowest against the US Dollar since the middle of June over the past 24 hours after GBP/USD dropped almost 1% in the worst 24-hour period since the end of July. In response, retail traders have started to increase upside exposure. This can be seen by looking at IG Client Sentiment (IGCS), which often functions as a contrarian indicator. With that in mind, could further pain be in store for Sterling?
GBP/USD Sentiment Outlook – Bearish
The IGCS gauge shows that about 62.44% of retail traders are net-long GBP/USD. Since most of them are biased higher, this hints that prices may fall down the road. This is as upside exposure increased by 23.86% and 25.24% compared to yesterday and last week, respectively. With that in mind, the combination of current sentiment and recent changes offers a stronger bearish contrarian trading bias.
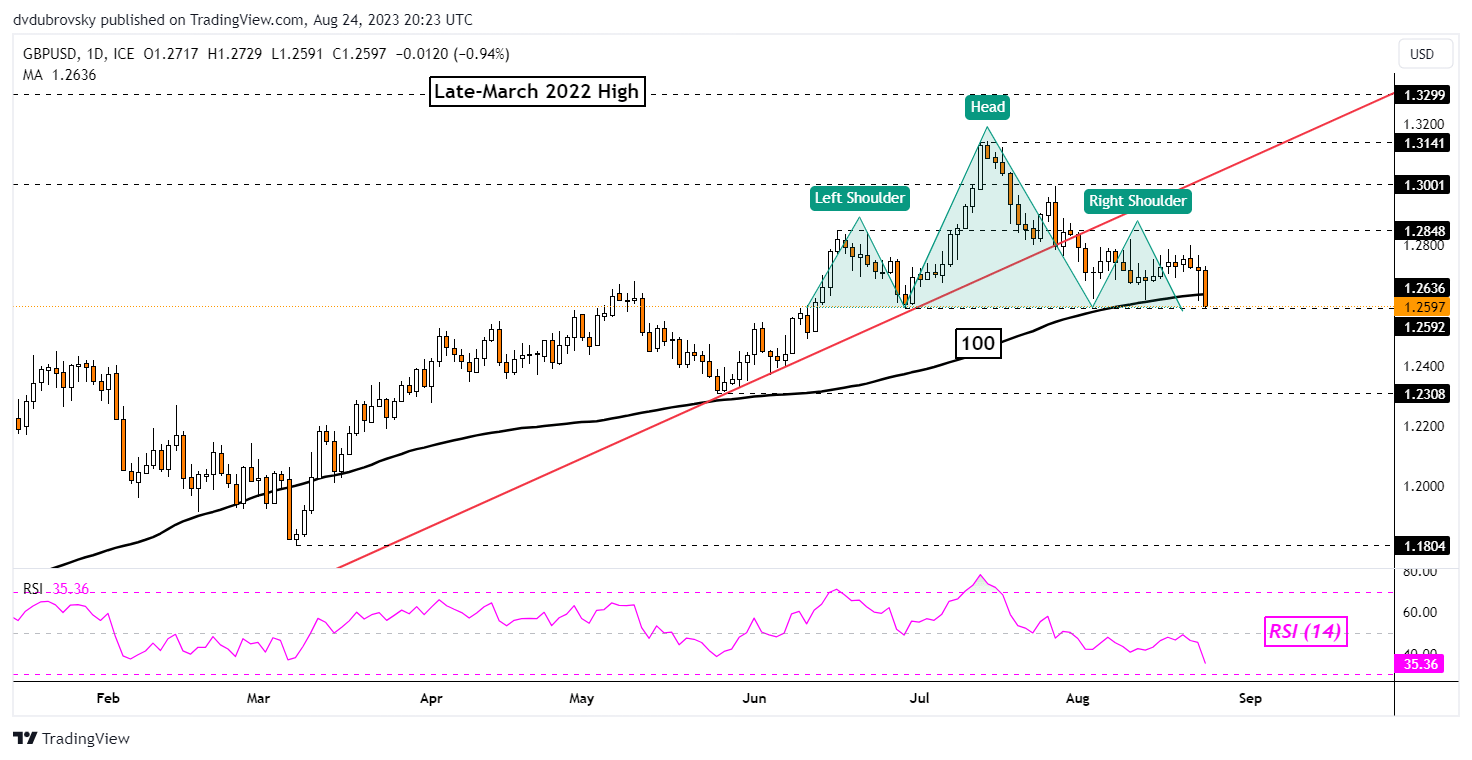
British Pound Daily Chart
On the daily chart below, GBP/USD had fallen to the neckline of a developing bearish Head & Shoulders chart formation. On top of this, prices have broken under the 100-day Moving Average (MA), opening the door to an increasingly bearish technical conviction. Further downside confirmation exposes the May low of 1.2308.
Meanwhile, in the event of a turn higher, the right shoulder peak is sitting just below 1.2848. Pushing above this price opens the door to undermining the chart formation, placing the focus on the former rising trendline from last year.

--- Written by Daniel Dubrovsky, Senior Strategist for DailyFX.com


