
British Pound, GBP/USD, Sterling, IG Client Sentiment – Technical Forecast
- British Pound appears to be forming an Ascending Triangle
- The direction of the triangle’s breakout could be key ahead
- Retail traders keep buying up GBP/USD, a bearish signal?

British Pound Eyeing Ascending Triangle
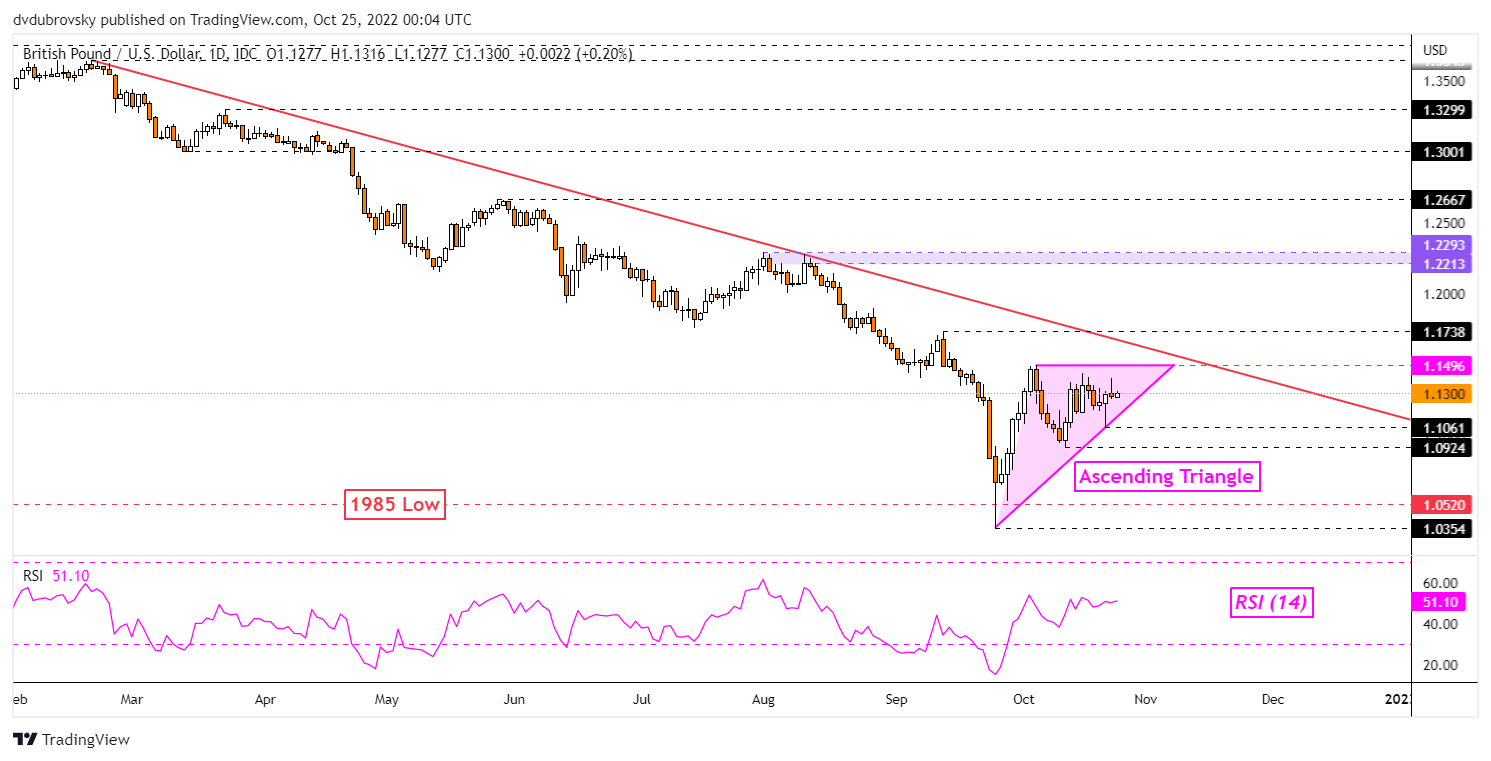
The British Pound has been consolidating against the US Dollar in recent weeks. Taking a closer look, it appears that GBP/USD could be forming an Ascending Triangle chart formation. The outer layer of the ceiling appears to be at 1.1496. Meanwhile, the rising floor of the triangle has its roots from the September low – see the daily chart below.
The direction of Sterling’s breakout from the triangle could be key for determining the coming trend. Confirming a breakout under rising support places the focus on 1.1061 before the October 12th low at 1.0924 kicks in. Such an outcome would open the door to extending the dominant downtrend since the beginning of this year.
That places the focus on the 1985 low at 1.0520, as well as the all-time low of 1.0354. In the event of a breakout higher instead, keep a close eye on the falling trendline from February. That could reinstate the dominant downtrend. If not, key resistance above seems to be the September high at 1.1738 before the 1.2213 – 1.2293 zone from July kicks in.
GBP/USD Daily Chart
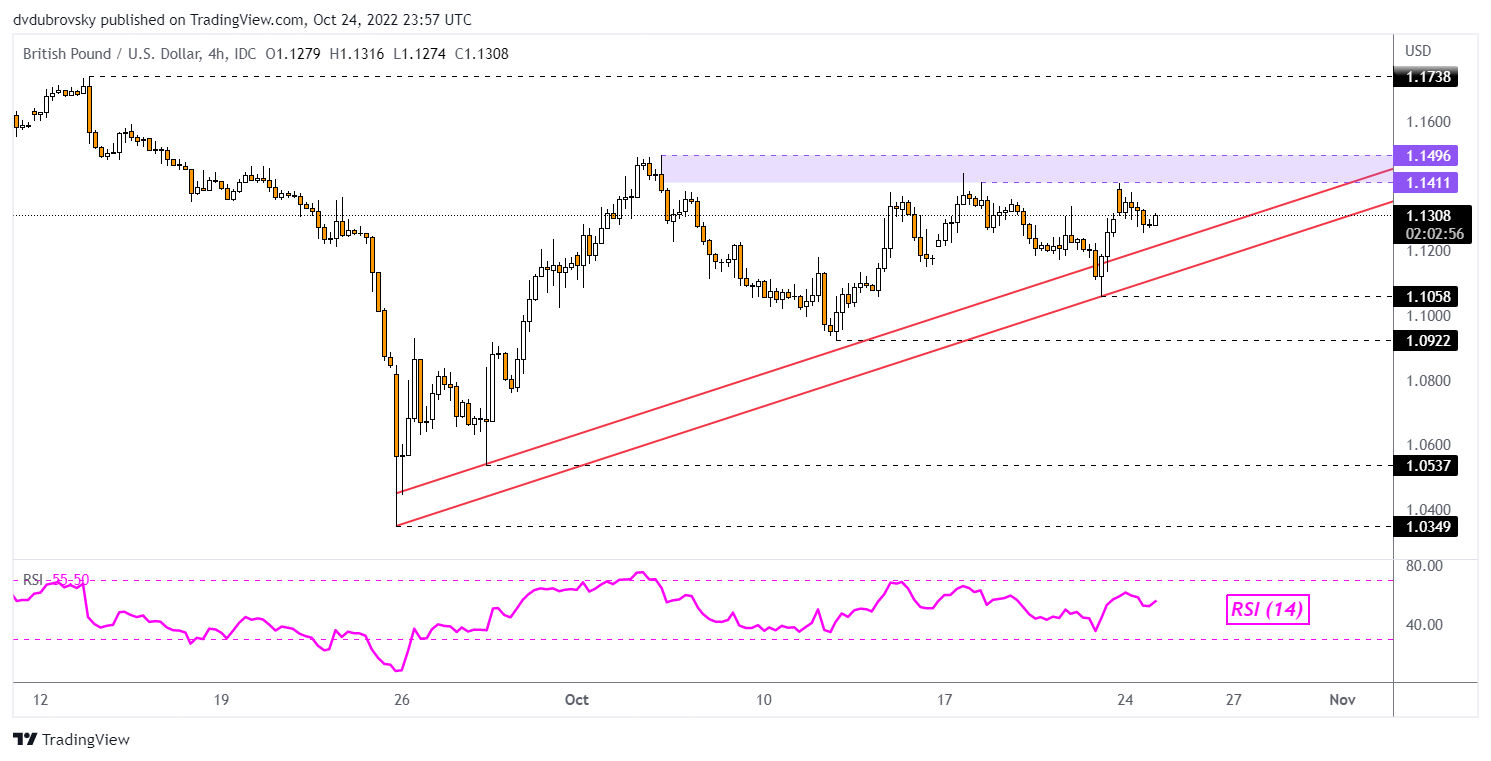
4-Hour Chart
Zooming in on the 4-hour timeframe below can give us a better picture of how the Ascending Triangle is taking shape. Sterling is quickly running out of room to consolidate between the ceiling and the upward-sloping floor. Breaking under the floor exposes 1.1058 before 1.0922 kicks in. Watching these levels would likely offer preliminary directional signals.

British Pound Sentiment Analysis - Bearish
According to IG Client Sentiment (IGCS), about 61% of retail traders are net-long GBP/USD. IGCS tends to function as a contrarian indicator. Since most traders are net-long, this hints that prices may continue falling. This is as upside exposure increased by 20.91% and 23.20% compared to yesterday and last week, respectively. With that in mind, the combination of current sentiment and recent changes offers a stronger bearish contrarian trading bias.
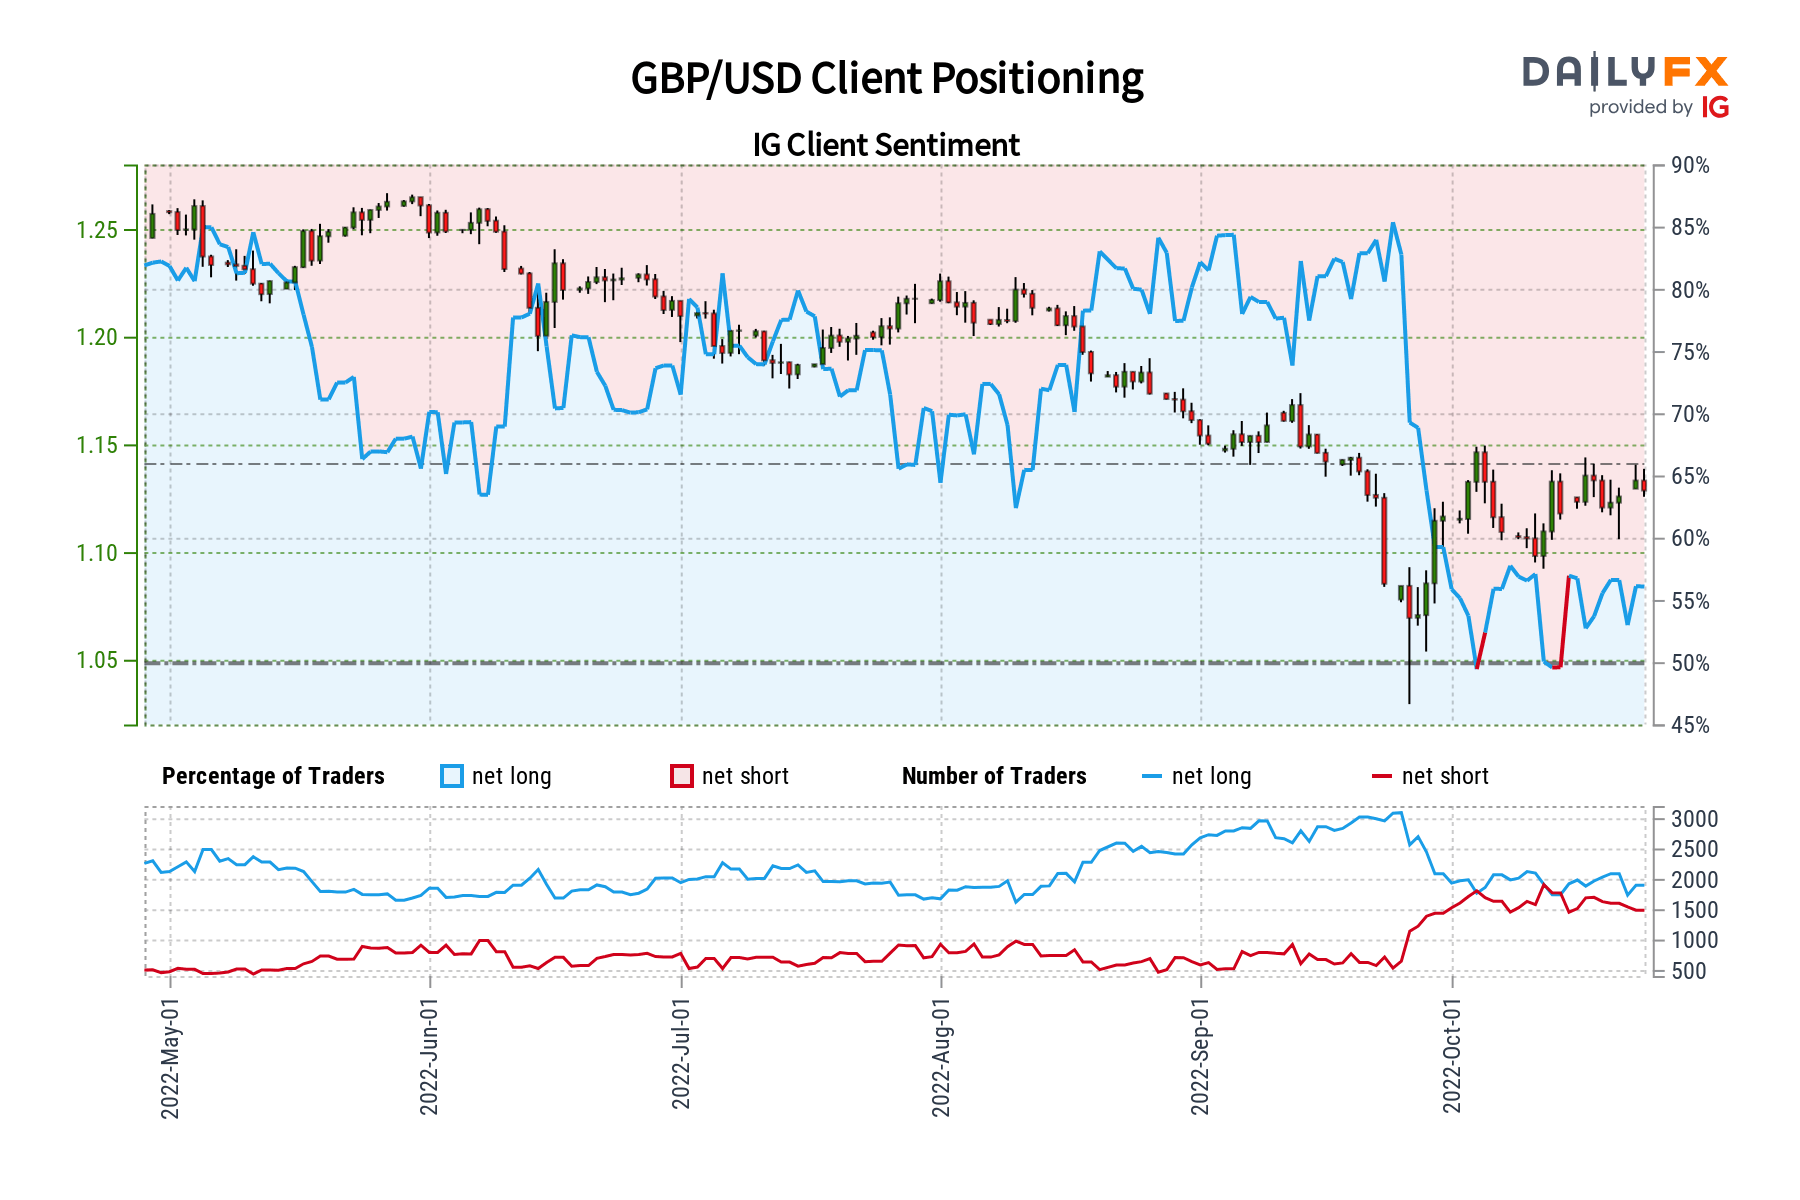
*IGCS chart pulled from October 24th report
--- Written by Daniel Dubrovsky, Strategist for DailyFX.com
To contact Daniel, use the comments section below or@ddubrovskyFXon Twitter