Dow Jones 30, Nasdaq 100, Hang Seng 50 - Analysis and Charts
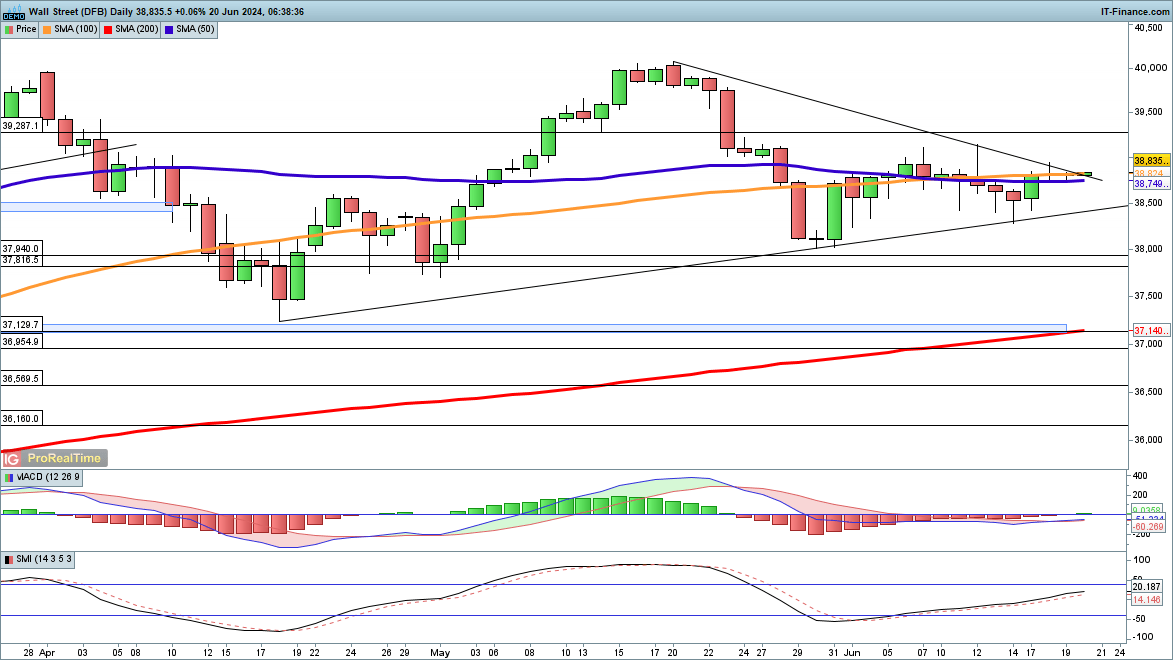
Dow edges higher
The index continues to lag behind the S&P 500 and the Nasdaq 100, which have both hit record highs this week.Gains since the end of May have been modest, but in the short-term the price has avoided a close below trendline support from the April low. It is now pushing above trendline resistance from the May highs and a close above 39,000 will help to bolster the bullish view in the short term.
A close back below 38,500 and then below trendline support would revive the bearish view in the short-term.
Dow Jones 30 Daily Chart
| Change in | Longs | Shorts | OI |
| Daily | -8% | 0% | -3% |
| Weekly | -14% | 2% | -5% |
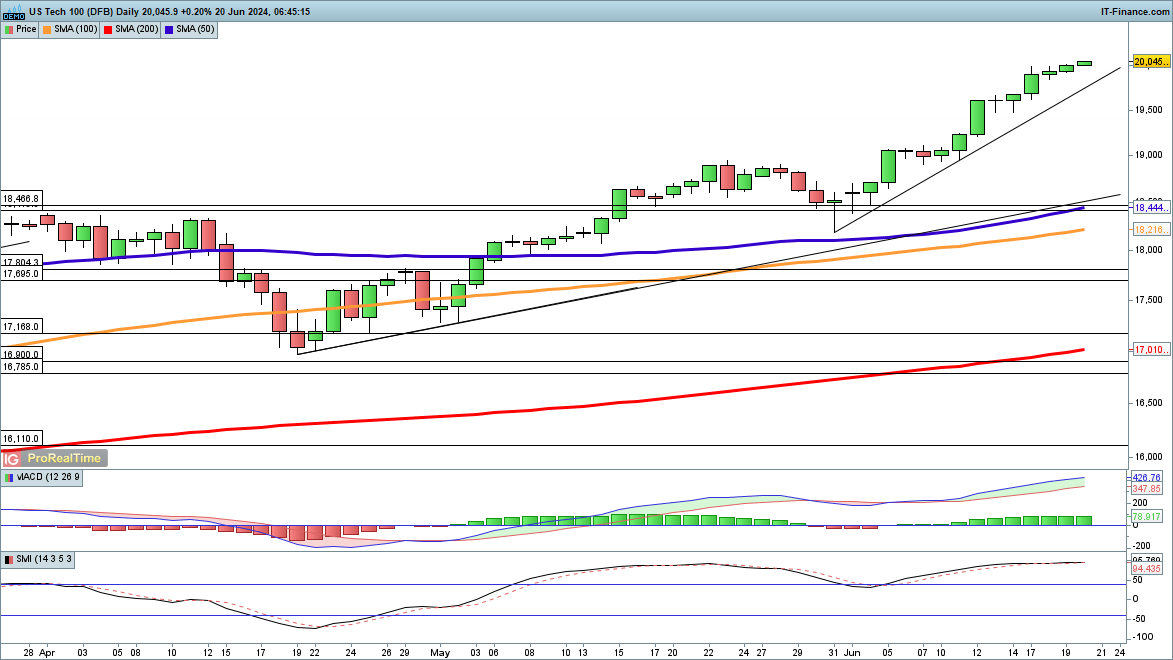
Nasdaq 100 vaults above 20,000
Futures have pushed above 20,000 for the first time, capping an impressive bounce from the April low. The latest leg higher took the price from 18,200 to its current level, with no sign of a reversal yet in view. Short-term trendline support from the late May low remains in place.
A short-term move below 19,500 might suggest a high has been reached for now.
Nasdaq100 Daily Chart

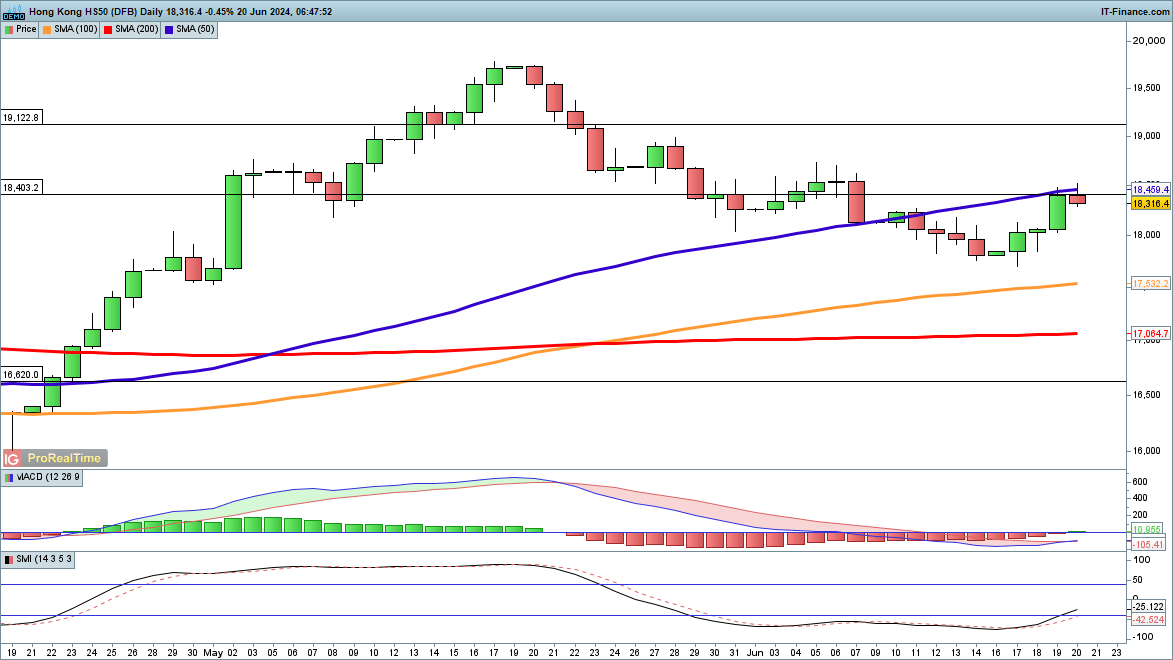
Hang Seng higher low in place?
The index has made strong gains over the past four sessions and has rallied back to the 50-day simple moving average (SMA).Bulls will hope that the index is now poised to turn higher after a six-week-long pullback from the highs of May. A close above the 50-day SMA opens the way to the highs of early June around 18,600.
Beyond this, the price will make gains towards 19,000 and then on to the May highs at 19,750.
Hang Seng 50 Daily Chart