Dow Jones 30, Nasdaq 100, Nikkei 225 Analysis and Charts
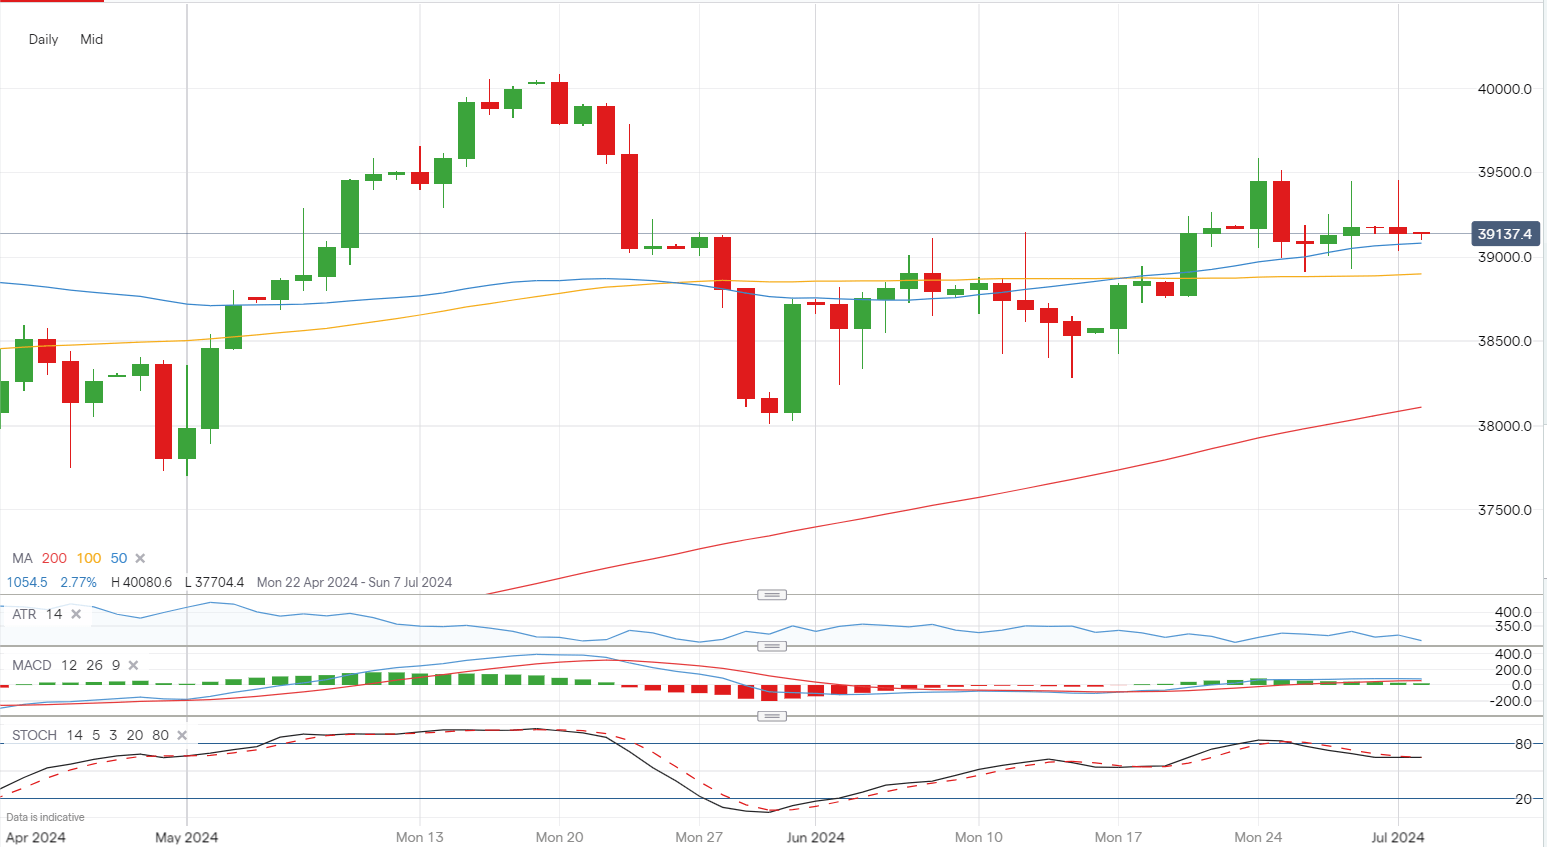
Dow still unable to break higher
The index again attempted to make solid gains on Monday, pushing back towards 39,500, but it was unable to hold the highs of the session, essentially a repeat of Friday.However, it is also true that the price has not closed significantly lower, with buyers defending the 39,000 area. This short-term range will need to be broken to provide a more conclusive view of the next likely move.
A close above 39,500 would mark a bullish development, and open the way to the May highs, while a close below 39,000 might spark a drop towards the June lows at 38,270.
Dow Jones Daily Chart
| Change in | Longs | Shorts | OI |
| Daily | -2% | -7% | -5% |
| Weekly | -13% | -5% | -9% |
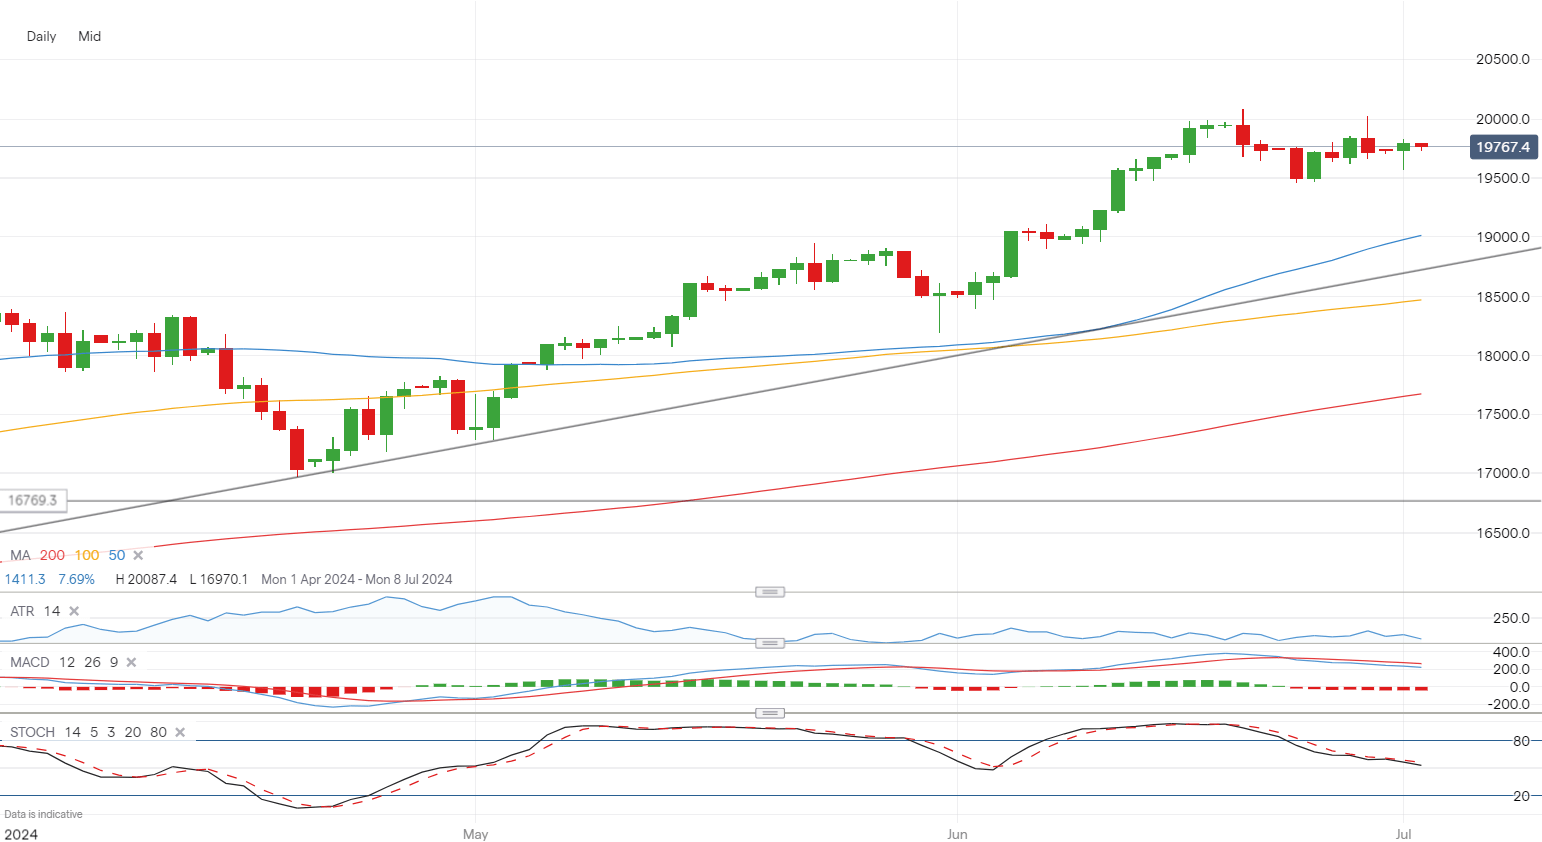
Nasdaq 100 still edging higher
The recovery from the late June low at 19,500 continues. Yesterday saw the index make a positive start to the week, building on last week’s bounce from 19,500. The 20,000 high from mid-June now comes into view once again, and beyond this, the index will be in new record-high territory.
A short-term bearish view requires a close back below 19,500.
Nasdaq 100 Daily Chart

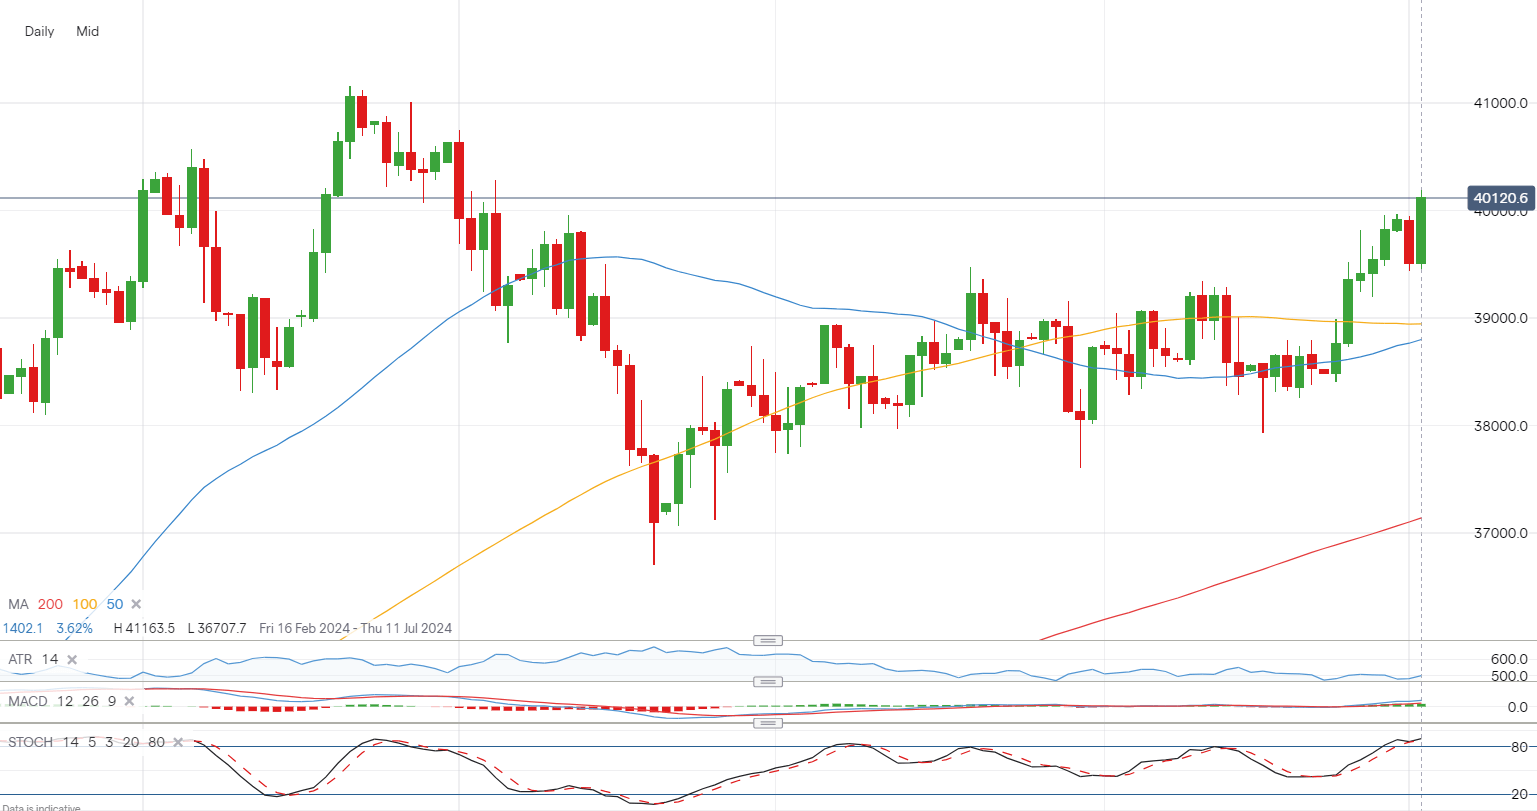
Nikkei 225 surges through 40,000
The index made strong gains overnight, and has moved back above 40,000. It now finds itself at its highest level since 4 June, arguably marking a resumption of the uptrend from the Q4 2023 lows. The next target would be the 41,000 highs from April, while beyond this the index will reach new record highs.
Buyers have wrested control over the past two weeks from the sellers, and in the short-term a close below 39,000 and then 38,000, a key support level in May and June, would be needed to suggest that the index is headed lower.
Nikkei 225 Daily Chart