

Euro, EUR/USD, US Dollar, EUR/JPY, Japanese Yen, Momentum - Talking points
- EUR/USD ascending trend remains intact as it makes a new peak
- EUR/JPY is still in the range but there could be something brewing
- A bullish perspective could be viewed for EUR/USD, but EUR/JPY looks challenging

EUR/USD TECHNICAL ANALYSIS
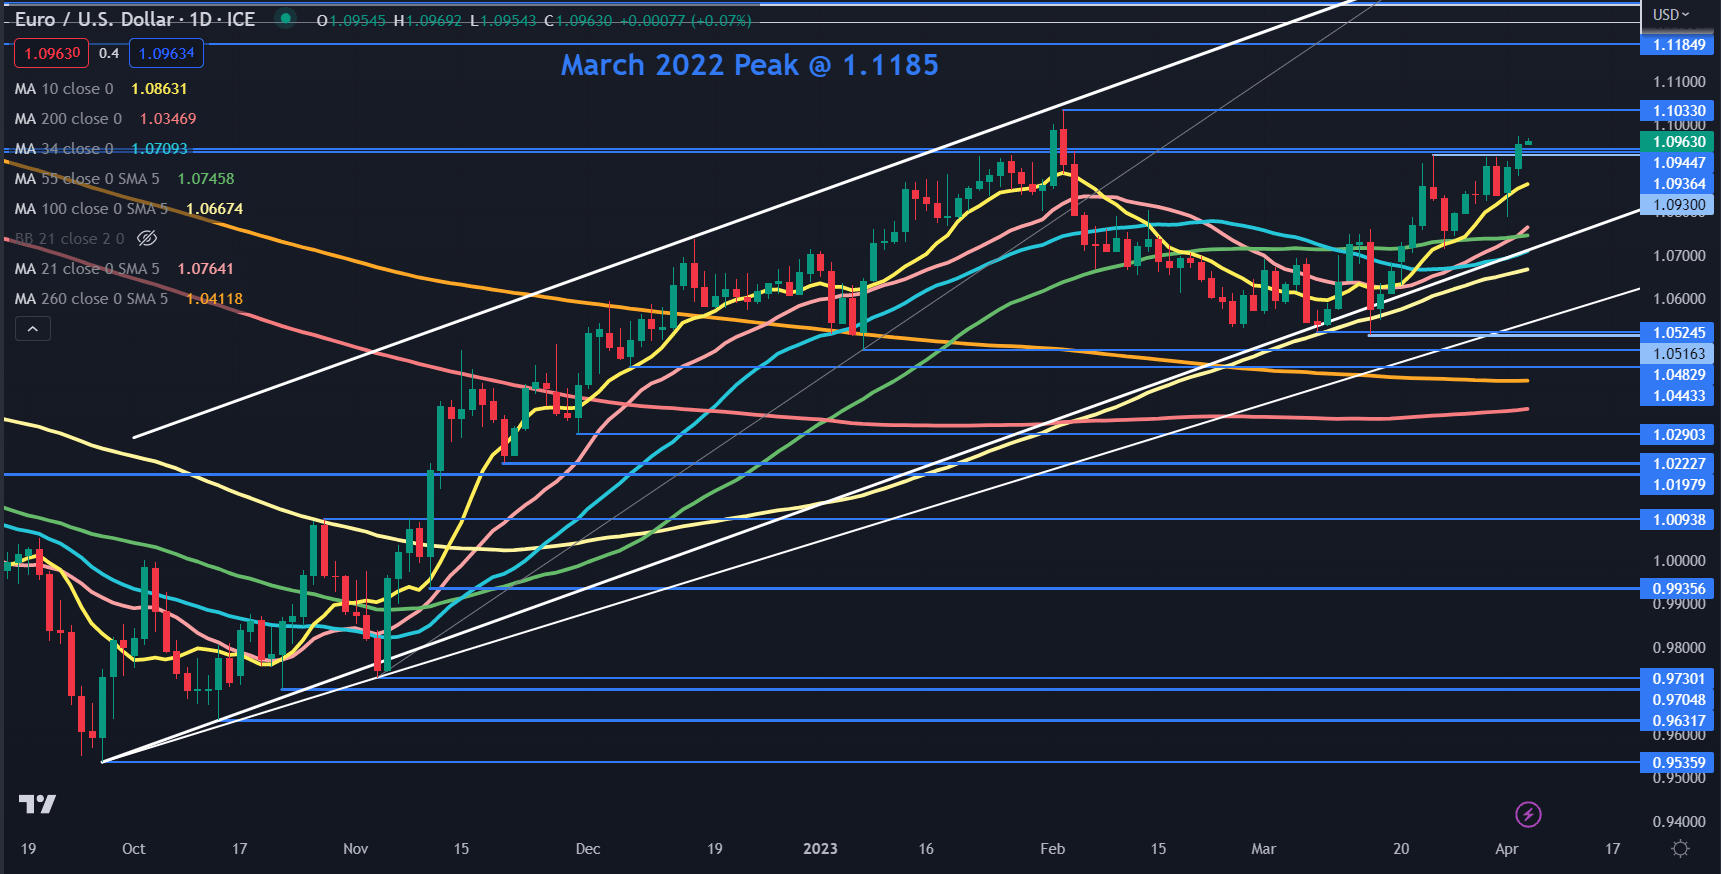
EUR/USD made a 9-week high going into the New York close overnight, breaking above a recent peak and some breakpoints and it remains in an ascending trend channel. Moving above these resistance levels may suggest confirmation of bullish momentum.
Resistance might be at the early February high of 1.1033 or the March 2022 peak of 1.1185.
A bullish triple moving average (TMA) formation requires the price to be above the short-term SMA, the latter to be above the medium-term SMA and the medium-term SMA to be above the long-term SMA. All SMAs also need to have a positive gradient.
With the 200- and 260-day SMA gradients turning positive, looking at any combination of daily SMAs the conditions have been met for a bullish TMA. It should be noted though that past performance is not indicative of future results.
The currency pair tested the lower bound of the ascending trend channel in early March but was unable to sustain a break below the trendline and the 100-day simple moving average (SMA). The trend line may continue to provide support, currently at 1.0720.
Further down, support may lie at the previous lows of 1.0525, 1.0516, 1.0483 and 1.0443.
Trade Smarter - Sign up for the DailyFX Newsletter
Receive timely and compelling market commentary from the DailyFX team
EUR/JPY TECHNICAL ANALYSIS
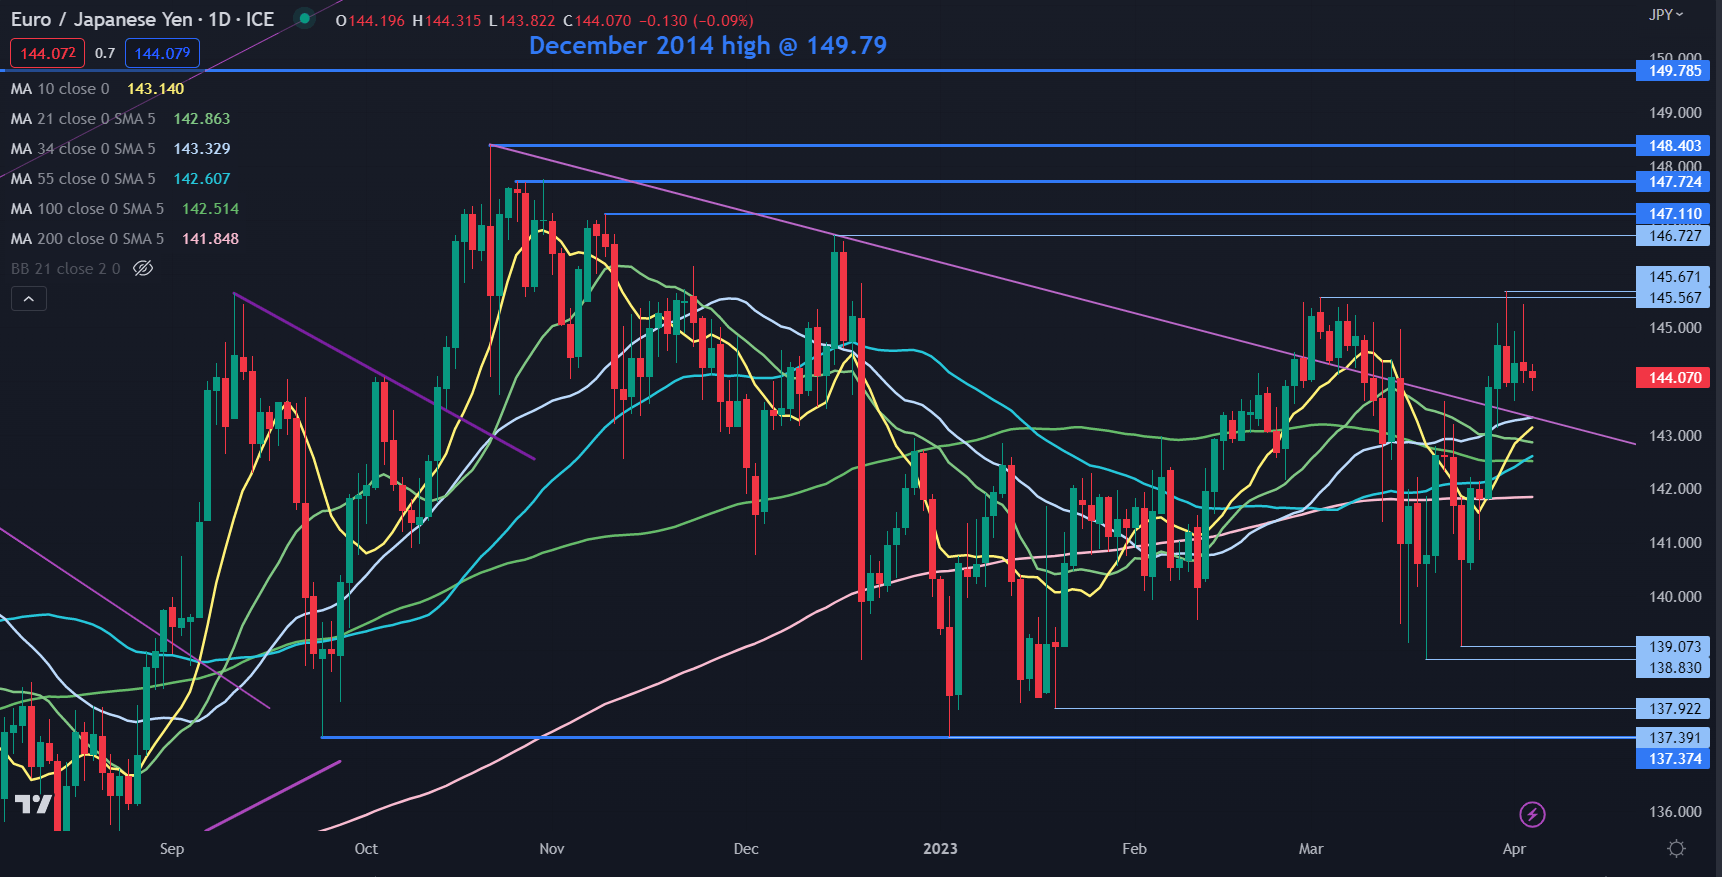
EUR/JPY has been caught within a 137.37 – 148.40 range for seven months.
At the end of last month, it narrowly broke above resistance but was unable to hold above it and these peaks at 145.57 and 145.67 may offer resistance ahead of the breakpoint at 146.14.
Further up, resistance could be at the previous highs of 146.73, 147.11, 147.72 and 148.40.
All the short, medium and long-term simple moving averages (SMA) are clustered in a fairly narrow band between 141.85 and 143.33.
This could be interpreted in two ways. Either the range trade is still in play or with the price above these SMAs, bullish momentum might be evolving.
A move below any SMA might suggest the former while a break above the recent high of 145.67 may confirm the latter.
On the downside, support could lie at the prior lows of 139.07, 138.84, 137.92 and the Double Bottom at 137.37.
--- Written by Daniel McCarthy, Strategist for DailyFX.com
To contact Daniel, use the comments section below or @DanMcCathyFX on Twitter