

Euro, EUR/USD, US Dollar, EUR/JPY, Japanese Yen, EUR/GBP, British Pound, Trend, Range - Talking Points
- Euro bearishness might be intact against the US Dollar in the near term
- The bullish case for EUR/JPY could have some legs after a brief plunge
- EUR/GBP may see a breakout at some stage. What are the levels to watch?

EUR/USD TECHNICAL ANALYSIS
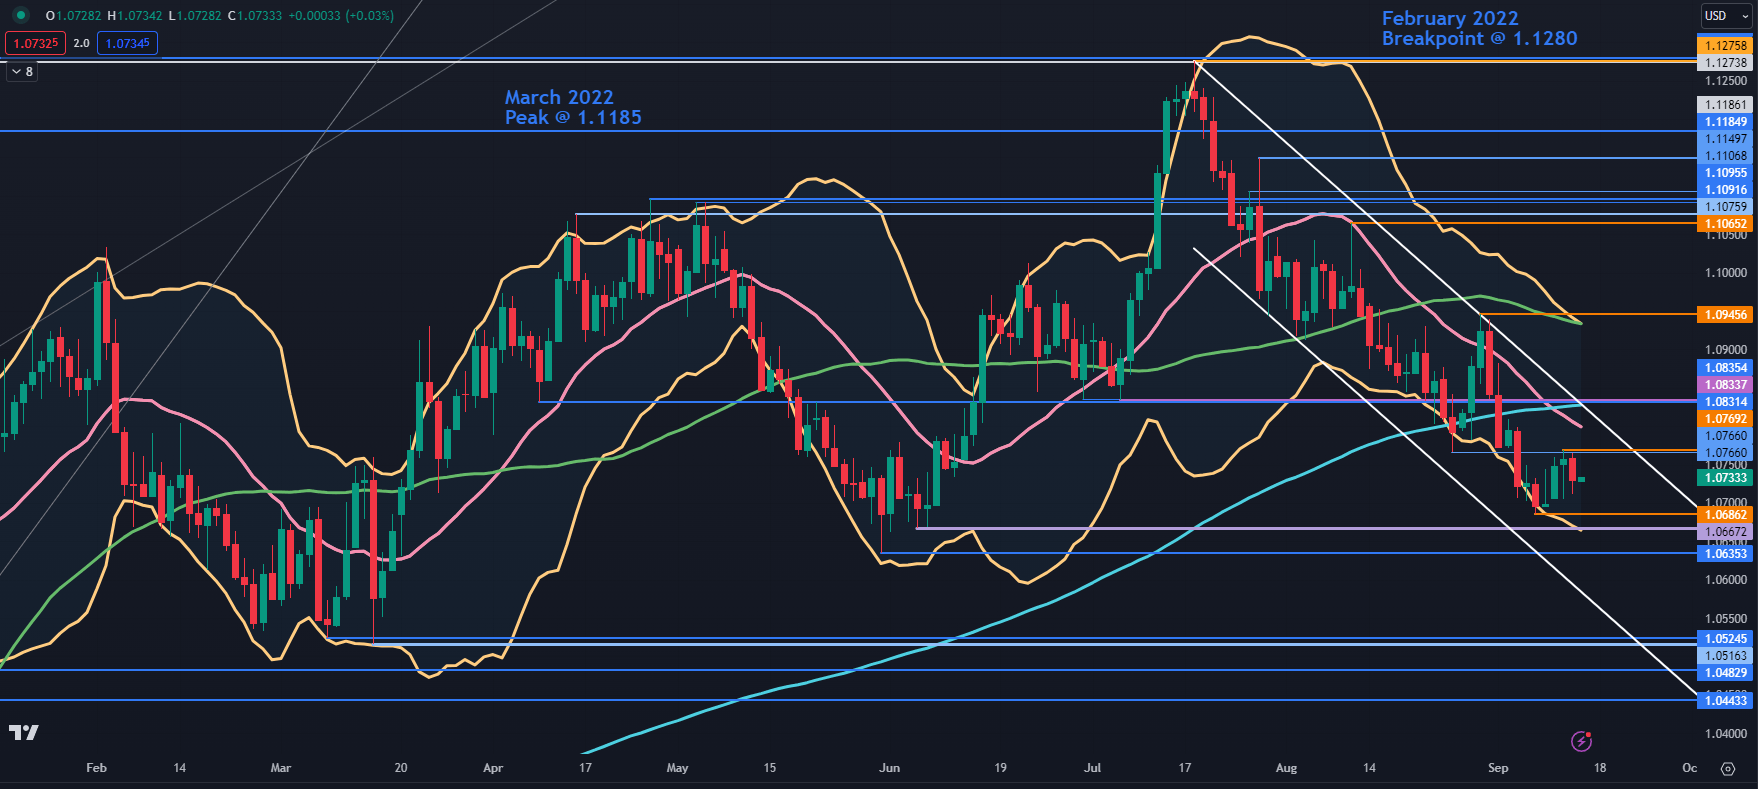
EUR/USD has consolidated this week after making a 3-month low last Thursday.
The close on that day was below the lower band of the 21-day Simple Moving Average (SMA) based Bollinger Band.
The day after, it closed back inside the band. This might technically signal a pause in the bearish run or a potential reversal.
Conversely, the price remains in a descending trend channel that emerged after making a peak in July at 1.1276 which was among two breakpoints of 1.1273 and 1.1280. This might set up the 1.1270 – 1.1280 area as a resistance zone.
With these conflicting signals in mind, the recent retreat from pushing lower might confirm the range trading environment for EUR/USD. It has traded between 1.0516 and 1.1276 since the beginning of 2023.
To learn more about range trading, click on the banner below.

Nearby resistance could be at Tuesday’s high near 1.0770, which also has a breakpoint nearby. Above there, a series of breakpoints in the 1.0530 – 1.0835 area and the 200-day SMA may offer resistance.
Further up, the prior peak at 1.0945 and the 55-day SMA nearby, could offer resistance ahead of a cluster zone of breakpoints and recent highs in the 1.1065 – 1.1105 area.
On the downside, support may lie at the prior lows of 1.0686, 1.0667, 1.0635, 1.0525, 1.0483 and 1.0443.
EUR/USD DAILY CHART
EUR/JPY TECHNICAL ANALYSIS
EUR/JPY appears to have rejected a move lower on Monday when it traded down to 159.58.
That dip broke below two previous lows and the 55-day Simple Moving Average (SMA) before closing back above all of them at the end of the session.
The sell-off could be interpreted as a stop-loss take-out rather than an emerging bear market. In any case, the ascending trend line remains intact, and a near-term range trade pattern seems to be unfolding.
Support could be in the 156.60 – 157.00 area ahead of the trend line, currently near 156.10. Support might be at the breakpoint at 153.45 and below there, the breakpoints at 151.61 and 151.07 as well as the recent low at 151.41 may also lend support.
On the topside, potential resistance might be at the prior peaks of 159.49 and 159.76.
EUR/JPY remains above an ascending line and the bullish trend might be intact for now. To learn more about trend trading, click on the banner below.

A bullish triple moving average (TMA) formation requires the price to be above the near-term simple moving average (SMA), the latter to be above the medium-term SMA and the medium-term SMA to be above the long-term SMA. All SMAs also need to have a positive gradient.
Looking at the 55-, 100- and 200-day SMAs, the criteria for a TMA have been met, which may suggest that bullish momentum is evolving.
EUR/JPY DAILY CHART

EUR/GBP TECHNICAL ANALYSIS
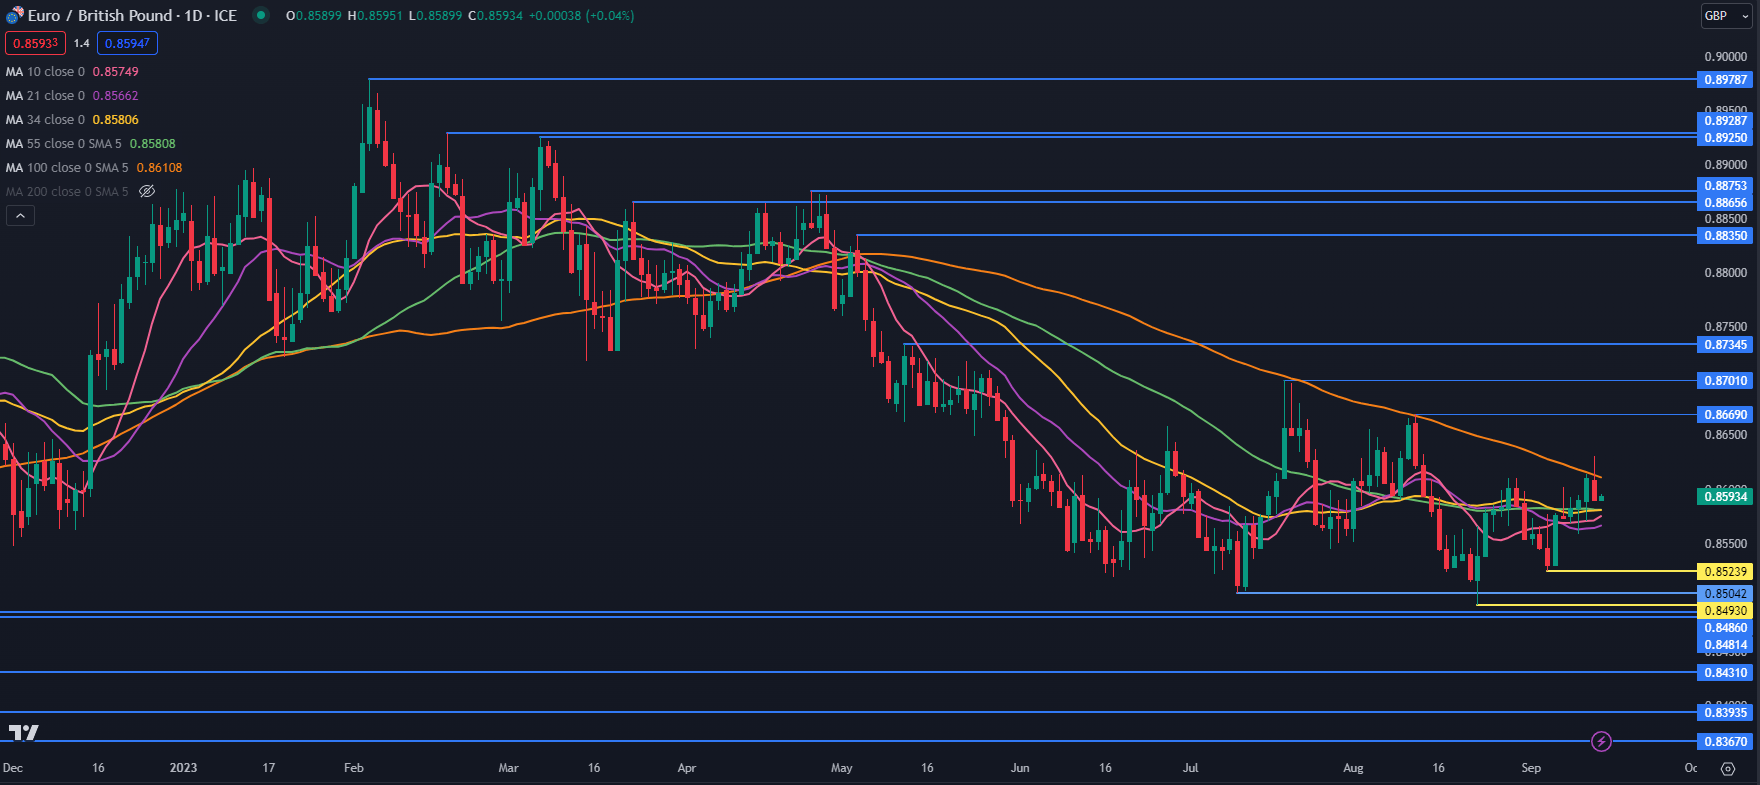
EUR/GBP has traded between 0.8493 and 0.8701 for 4 months in what appears to be a range trading environment.
The 10-, 21-, 34-, 55- and 100-day SMAs are all grouped together between 0.8566 and 0.8611, which may confirm a lack of direction for EUR/GBP.
If either side of that range is penetrated, a breakout trade opportunity may evolve. To learn more about breakout trading, click on the banner below.

Support might be at the prior lows and breakpoints of 0.8524, 0.8504, 0.8493, 0.8486 and 0.8481.
On the upside, resistance could be at the 100-day SMA which is currently near 0.8611. It held on two occasions in July and August but was briefly breached yesterday before tumbling back below it.
Further up, resistance might be at the previous peaks at 0.8669, 0.8701 and 0.8735.
EUR/GBP DAILY CHART
--- Written by Daniel McCarthy, Strategist for DailyFX.com
To contact Daniel, use the comments section below or @DanMcCathyFX on Twitter