FTSE 100, DAX 40, CAC 40 -Analysis and Charts
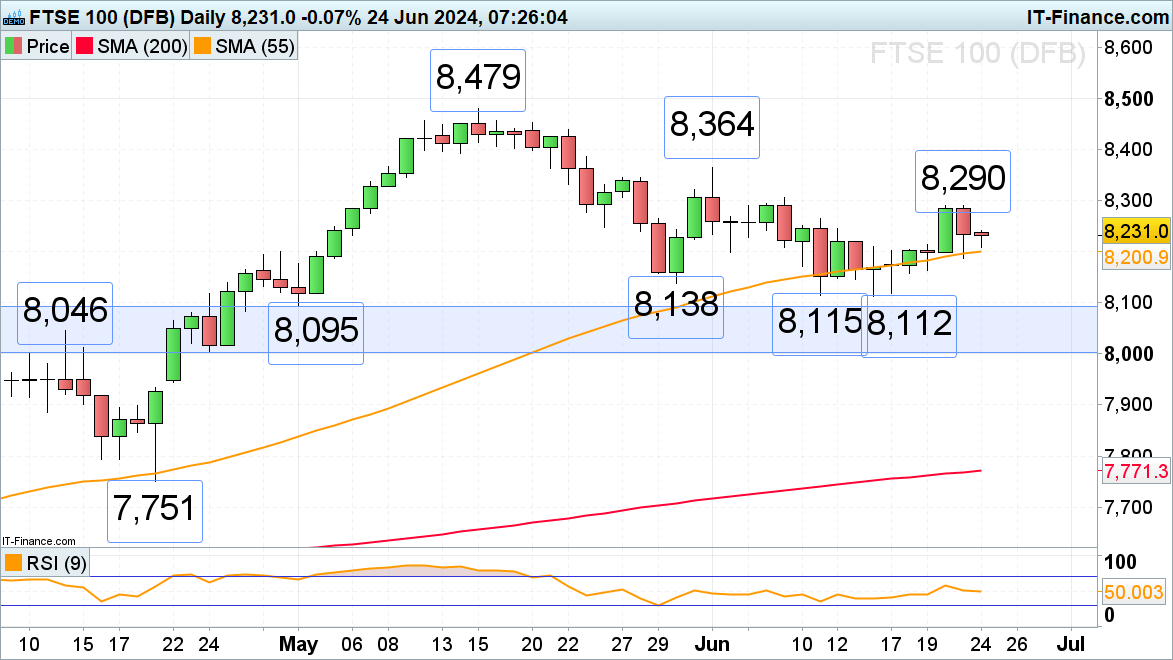
FTSE 100 range trades below last week’s high
The FTSE 100 continues to trade above the 55-day simple moving average (SMA) at 8,200 but below last week’s high at 8,290. A rise above Friday’s 8,290 high and the 7 June 8,306 high would put the early June high at 8,364 on the map. A fall through Friday’s low at 8,187 could provoke a sell-off to the 8,138 late May low, though.
FTSE 100 Daily Chart
| Change in | Longs | Shorts | OI |
| Daily | -2% | -3% | -3% |
| Weekly | 30% | -12% | 3% |
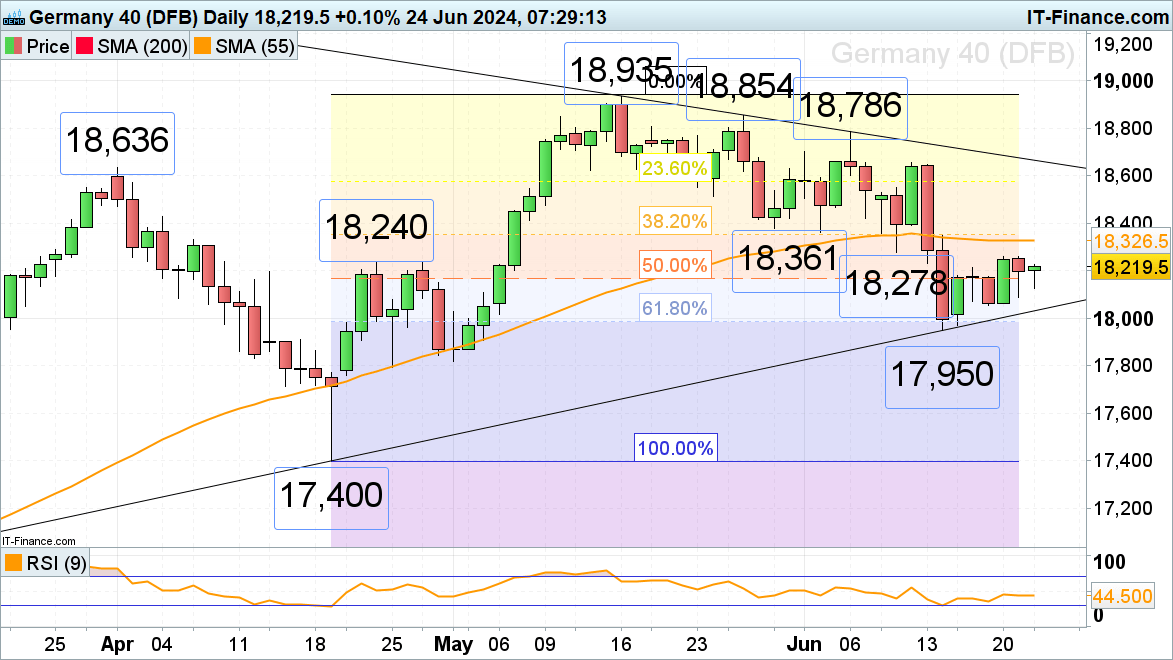
DAX 40 sideways trades around 50% retracement
The DAX 40 continues to oscillate around the 50% retracement of the April-to-May advance at 18,170 while range trading below last week’s 18,260 high and Wednesday’s 18,053 low as the German Ifo business climate index is published. A rise above 18,260 would put the 55-day simple moving average (SMA) at 18,326 and the 18,361 early June low on the cards.
Minor support can be seen at Monday’s 18,125 intraday low.
DAX 40 Daily Chart

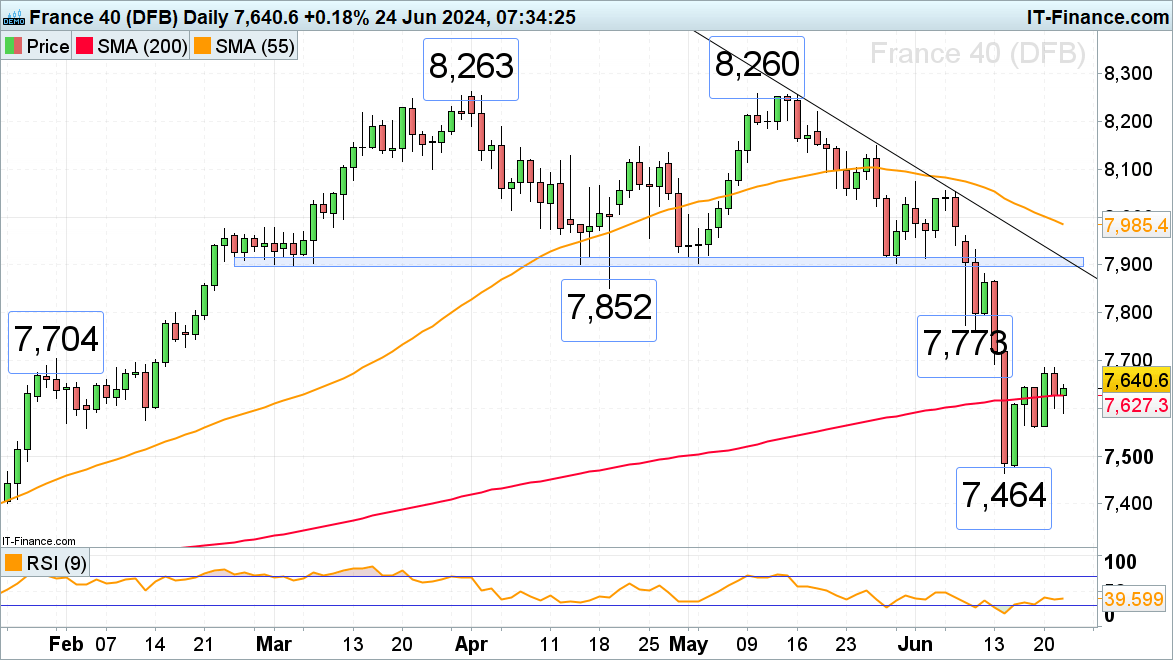
CAC 40 recovers from its 4 ½ month low
The French CAC 40 index is finding it difficult to recover from its mid-June sharp over 5% loss and instead is still trading along the 200-day simple moving average (SMA) at 7,627. A rise above last week’s high at 7,685 is needed for the 7,704 late January high to be in focus.
Minor support below Monday’s 7,590 intraday low can be spotted at Wednesday’s 7,559 low, below which lies the current June low at 7,464. Were a fall through 7,464 to occur, the December peak at 7,653 may offer support. If not, a drop toward the 7,281 January trough may be in the frame.
CAC 40 Daily Chart