FTSE 100, DAX40, CAC 40 Analysis and Charts
FTSE 100 rises amid Labour landslide
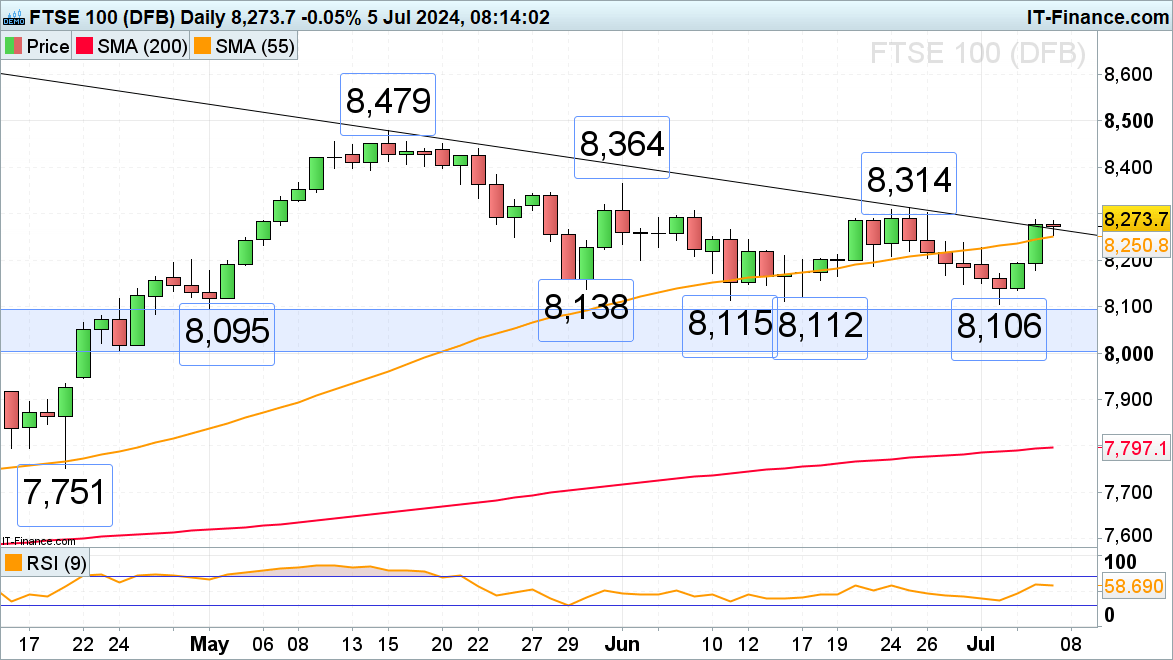
The FTSE 100 is in the process of breaking through its May-to-July downtrend line at 8,270 while gunning for its 8,314 late June high as the UK Labour party ousts the Conservatives after 14 years in power. Further up lies the 8,364 early June peak.
Minor support below the breached downtrend line can be seen along the 55-day simple moving average (SMA) at 8,251 and last Friday’s 8,239 high.
FTSE 100 Daily Chart
| Change in | Longs | Shorts | OI |
| Daily | 6% | 1% | 3% |
| Weekly | 4% | -2% | 1% |
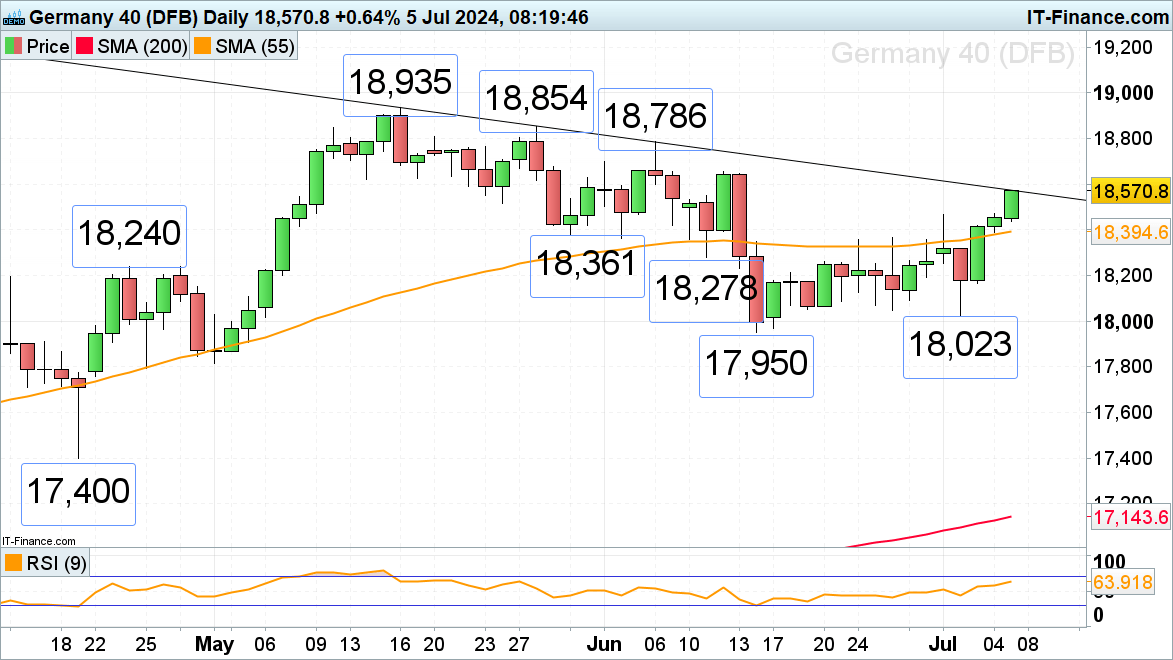
DAX 40 trades in two-week highs
The DAX 40’s swift rally over the past few days has taken it to its May-to-July downtrend line at 18,575 which may be a short-term cap. If overcome, the 12 June high at 18,654 would be back in the picture, as well as the 18,786 to 18,935 May to June peaks.
Slips may find support around Monday’s 18,466 high and the 55-day simple moving average (SMA) at 18,394.
DAX40 Daily Chart
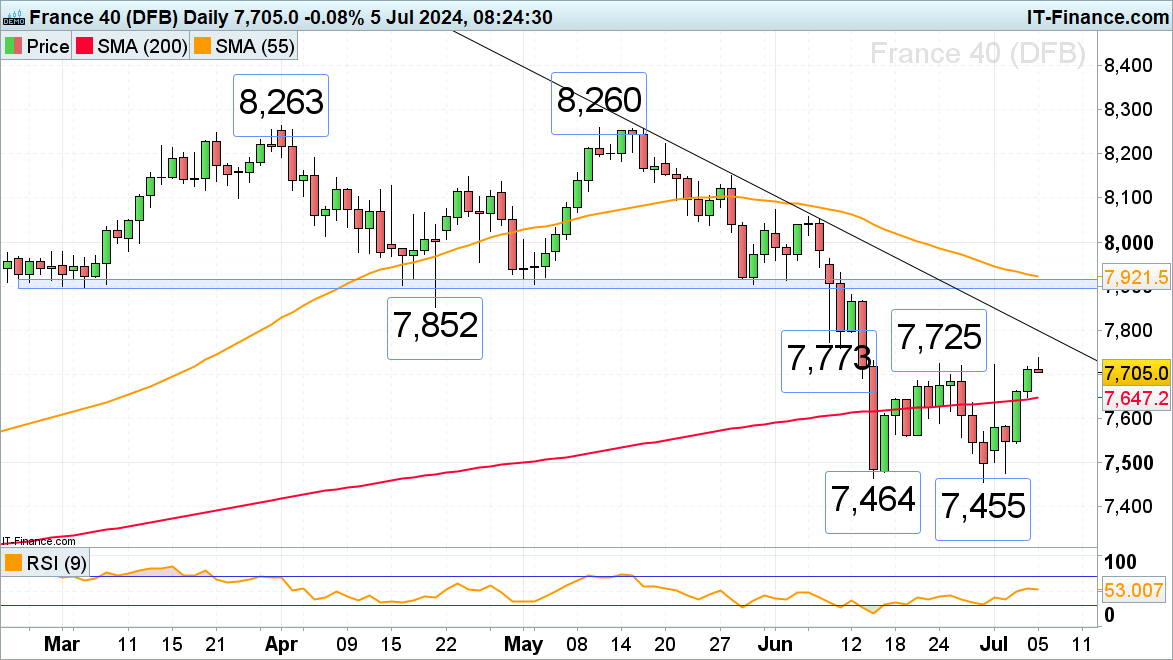
CAC 40 probes resistance
The French CAC 40 is flirting with its 24 June 7,725 high ahead of Sunday’s second round of French presidential elections at which the far-right Rassemblement National party is not expected to obtain an absolute majority but which could lead to a hung parliament.
While the 200-day simple moving average (SMA) at 7,647 underpins, the 7,725 high remains in sight, a daily chart close above which would confirm a double bottom chart formation that should take the index at the very least back to its 7,852 April low.
CAC 40 Daily Chart