FTSE 100, DAX 40, S&P 500 Analysis and Charts
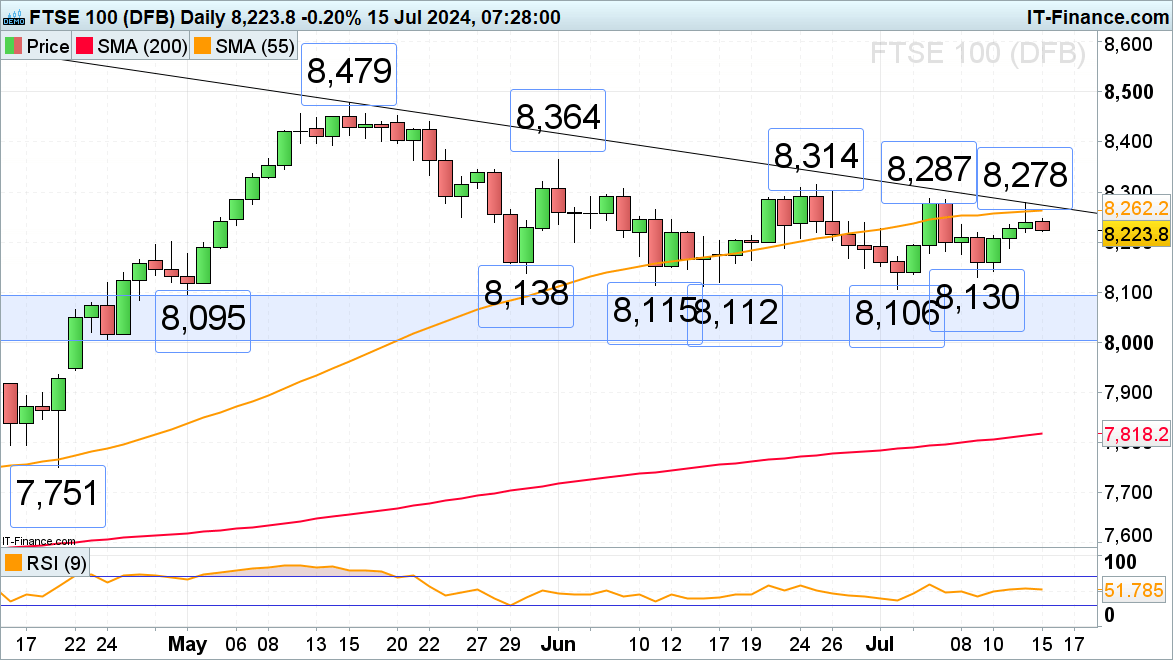
FTSE 100 continues to be side-lined
Following three straight days of gains, the FTSE 100 is finding it difficult to rise further still and trades back below the 55-day simple moving average (SMA) at 8,262, above which sits the 8,287 early July high. Further up the late June peak can be found at 8,314.
Potential slips may find support around the 8,200 level ahead of last week’s low at 8,130.
FTSE 100 Daily Chart
| Change in | Longs | Shorts | OI |
| Daily | -2% | -1% | -1% |
| Weekly | 11% | -6% | 1% |
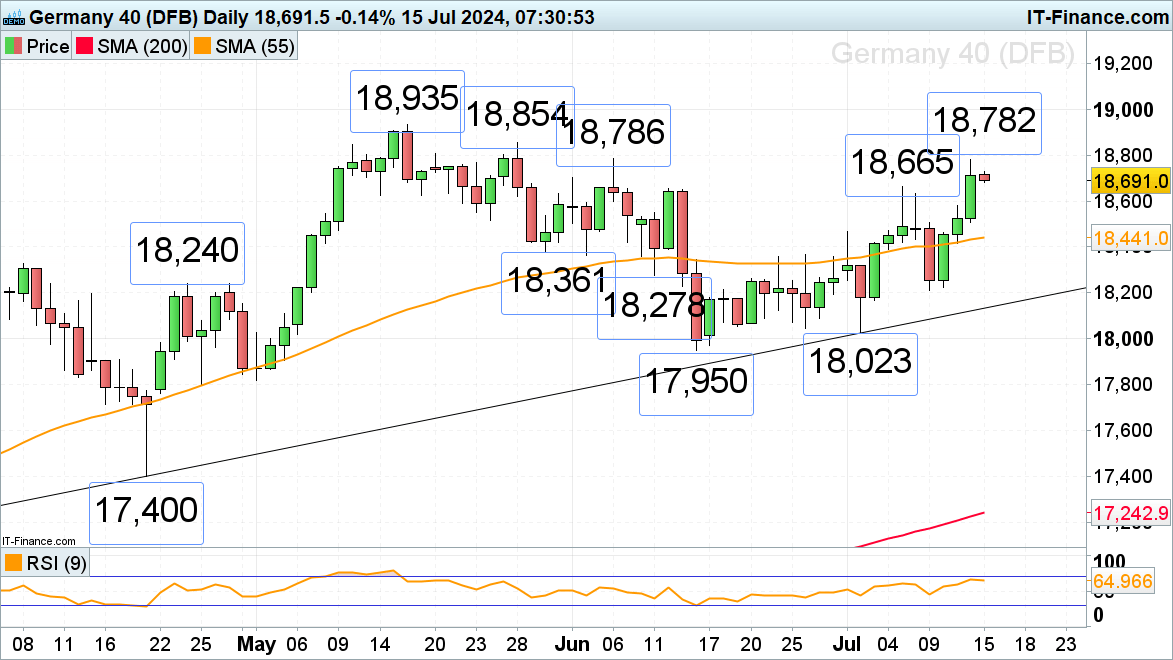
DAX 40 begins the week on a cautious note
The DAX 40’s advance has taken the index to above last week’s high at 18,665 to Friday’s 18,782 high, made close to the 18,786 early June peak. If bettered, the 18,854 to 18,935 mid-to-late May highs might be eyed next.
Minor support below 18,665 can be found between the 1 July high at 18,466 and the 55-day simple moving average (SMA) at 18,441.
DAX 40 Daily Chart

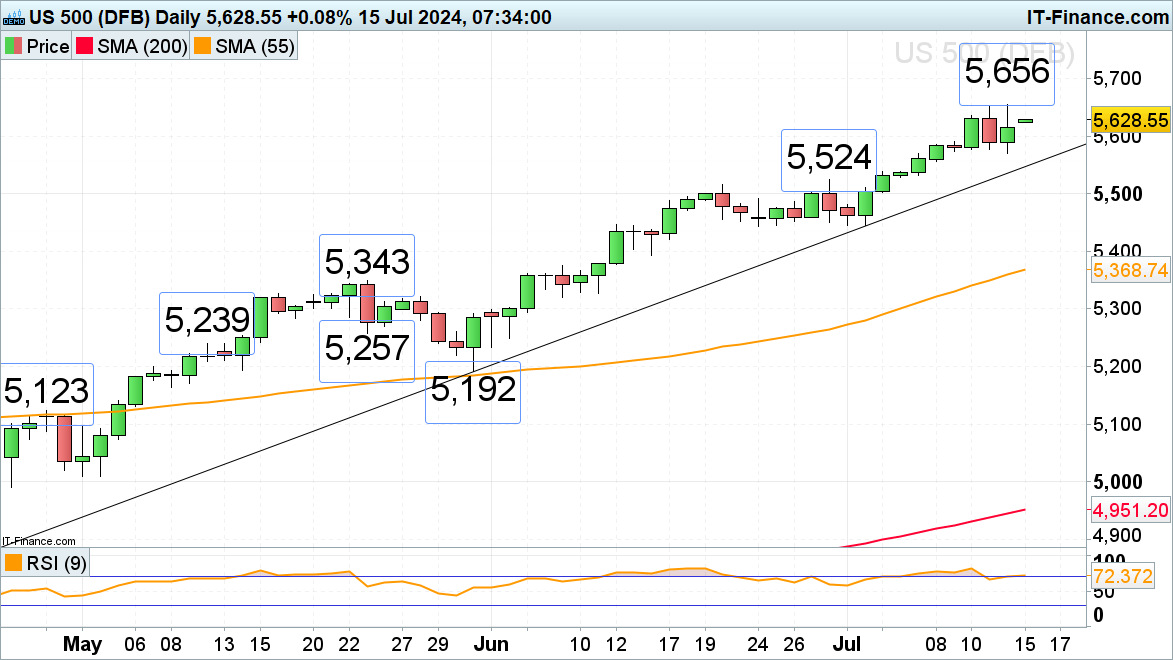
S&P 500 grinds higher still
The advance in the S&P 500 is ongoing as the Q2 earnings season has begun with the likes of Goldman Sachs reporting later today.While Friday’s low at 5,571 underpins, immediate upside pressure should be maintained with a rise above last week’s record high at 5,656 putting the 5,700 level on the map.
Were Friday’s low at 5,571 fallen through, though, the May-to-July uptrend line at 5,548 might be revisited.
S&P 500 Daily Chart