FTSE 100, DAX 40, CAC 40 Analysis and Charts
FTSE 100 slips alongside European indices
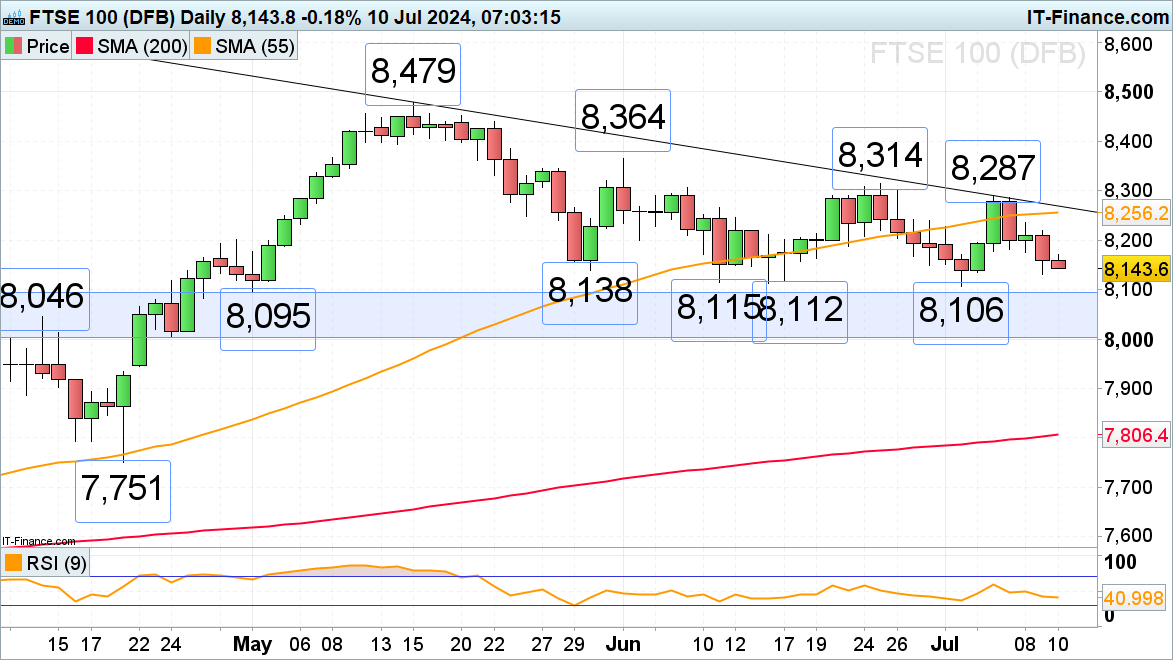
Last week’s FTSE 100 rejection by its May-to-July downtrend line at 8,287 has led to the late May low at 8,138 being revisited, a fall through which would open the way for the major 8,115-to-8,106 June-to-July lows to be retested.
Minor resistance is seen between the 4 to 8 July lows at 8,177 to 8,181.
FTSE 100 Daily Chart
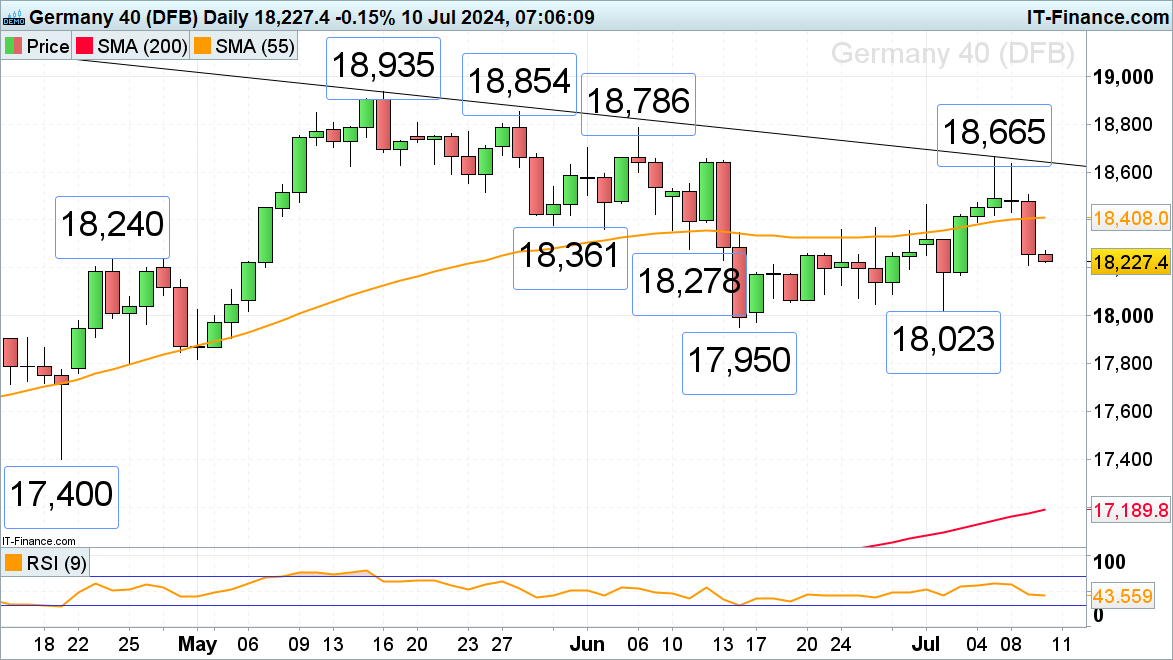
DAX 40 rapidly comes off its two-week high
The DAX 40’s rally to Friday’s 18,665 high has been followed by a sharp decline to Tuesday’s low at 18,211. Below it beckons the early July low at 18,023 and the June trough at 17,950.Minor resistance is seen between the 24 and 26 June highs at 18,367-to-18,357 and along the 55-day simple moving average (SMA) at 18,408.
Only a currently unexpected advance through the May-to-July downtrend line at 18,658 and above last week’s high at 18,665 would push the 18,786 to 18,935 May-to-June peaks to the fore.
DAX 40 Daily Chart
| Change in | Longs | Shorts | OI |
| Daily | 13% | -13% | -9% |
| Weekly | 8% | 0% | 2% |
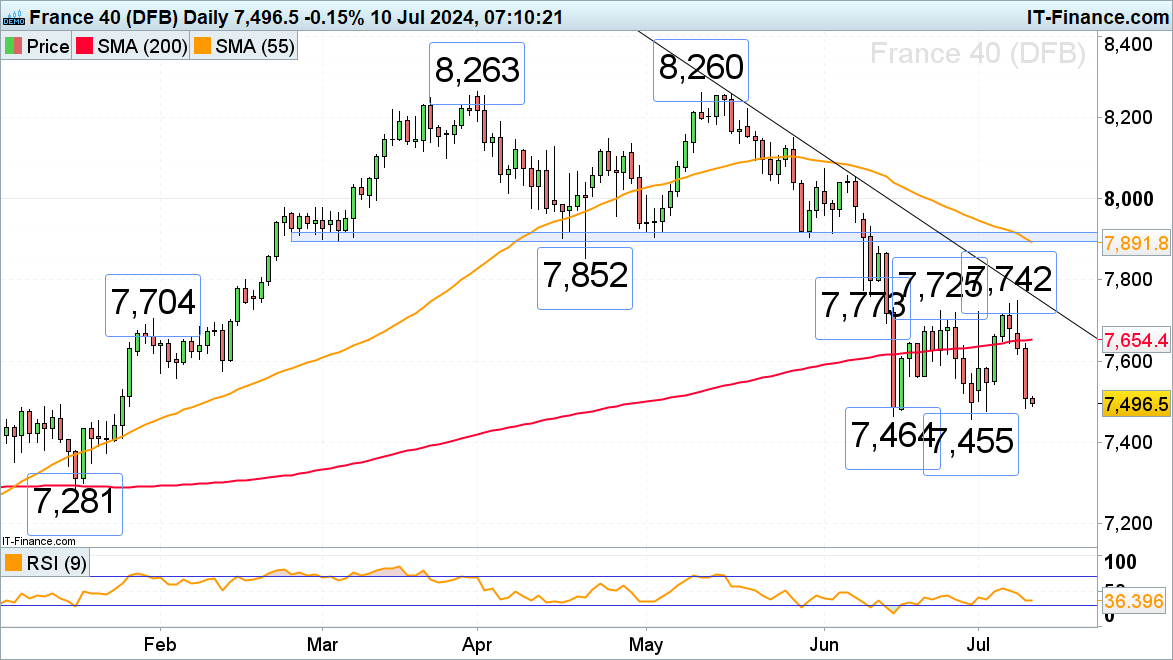
CAC 40 falls sharply as political turmoil grips the country
The French CAC 40, which on Monday morning saw a brief relief rally to 7,742 as the left-wing and not the far-right alliance won a relative majority in France’s legislative elections, has dropped by over 2% since. The index is fast approaching its mid-to-late-June lows at 7,464-to-7,455 which may soon give way. A fall through the 7,455 June low could provoke a slide towards the January low at 7,281 and perhaps even lead to the 7,000 region being revisited.
Resistance is far off along the 200-day simple moving average (SMA) at 7,654.
CAC 40 Daily Chart