
Gold, XAU/USD, Silver, XAG/USD - Technical Outlook:
- Risk of a minor pause in Gold’s rally, but the broader trend remains up.
- Short-term range outlook for silver remains unchanged .
- What are the key levels to watch?

GOLD TECHNICAL OUTLOOK - BULLISH
Lower timeframe charts suggest gold’s near three-month rally is beginning to look a bit tired, pointing to the risk of a minor pause in the rally in the near term. However, the broader trend continues to be up.
To be sure, there is no sign of reversal of the multi-week uptrend (refer to the previous article for more discussion on the trend). Even on the hourly and the 4-hourly charts, XAU/USD hasn’t broken any meaningful support that could point to an imminent pause/minor retreat. One such support is the mid-January low of 1896. Any break below could open the way toward the 30-day moving average (now at about 1878), with a fairly strong cushion around 1855 (including the 200-period moving average on the 4-hourly chart).
XAU/USD 4-Hour Chart
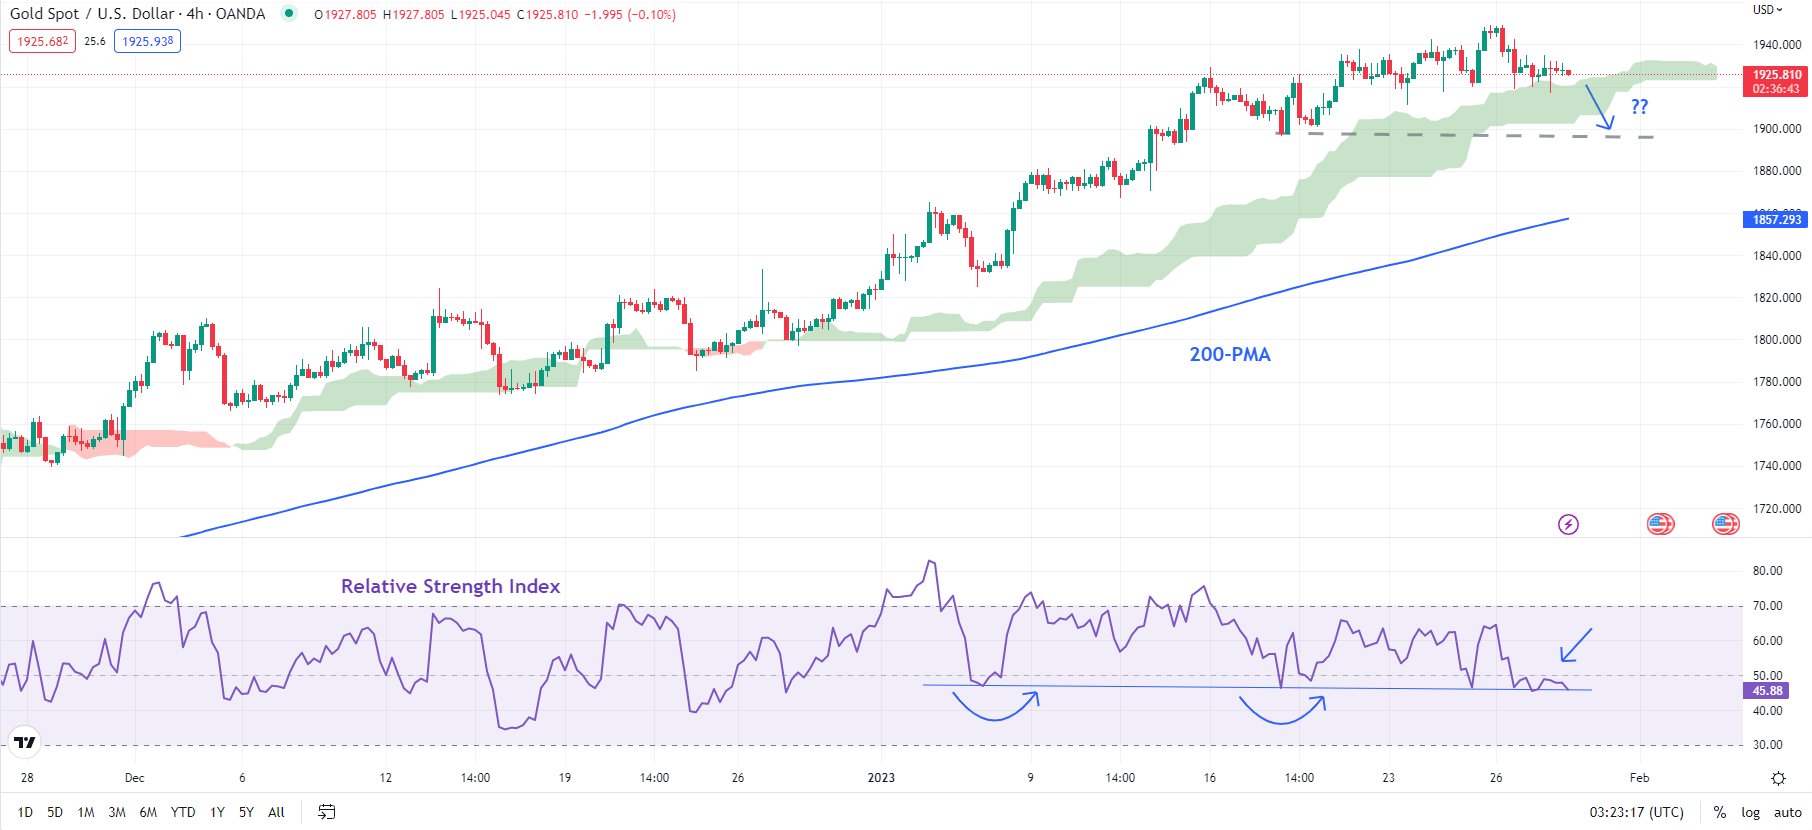
Chart Created Using TradingView
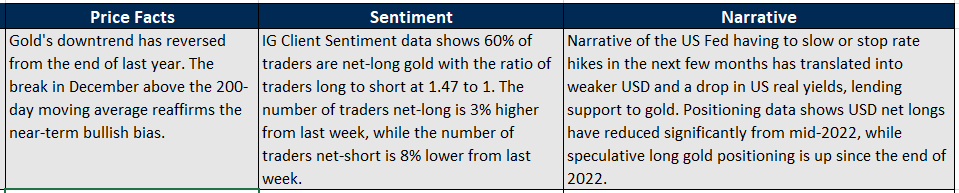
Beyond a few days, the yellow metal’s trend remains bullish after the grand reversal at the end of last year – from a downtrend channel to a rising channel (see the daily chart). The repeated breaks above key barriers, including the 200-day moving average, have confirmed that the interim trend remains up. Stiff resistance is at the April high of 1998, near the psychological 2000 mark.
XAU/USD Weekly Chart
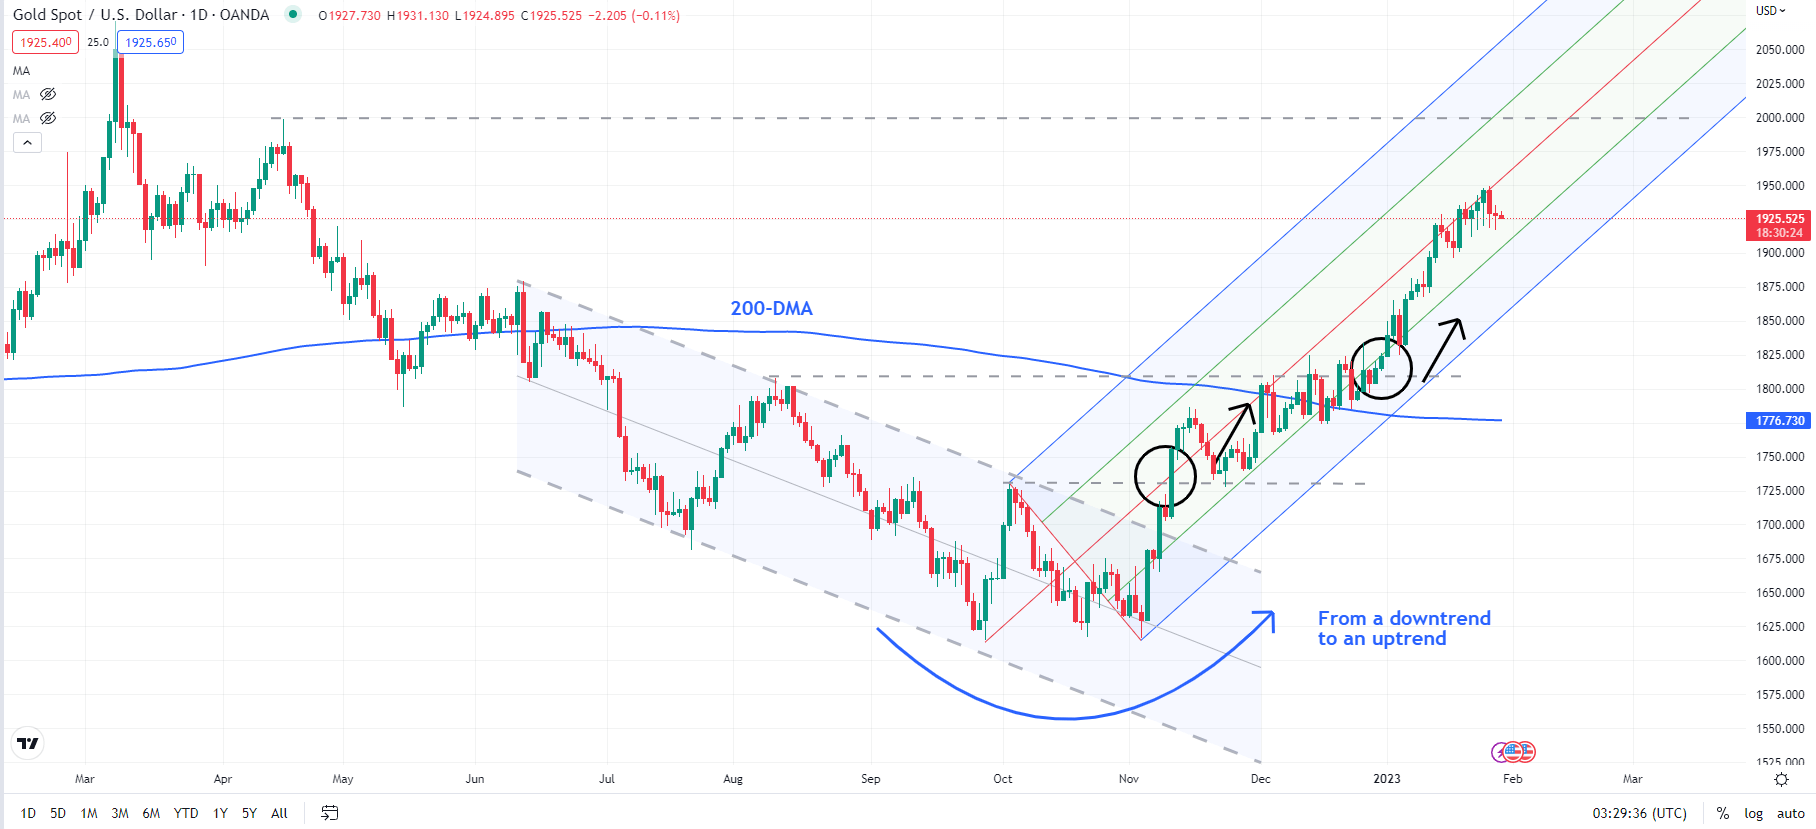
Chart Created Using TradingView
Zooming out, from a multi-month perspective, XAU/USD remains in a broad sideway range of around 1650-2050. In this regard, the rebound last year from a vital floor on the 200-week moving average was an encouraging sign for bulls, keeping hopes alive that the uptrend from 2015 remains in force.
SILVER TECHNICAL OUTLOOK - NEUTRAL
Silver’s outlook remains unchanged from last week, that is, continuity of a range, with a possible minor downward bias over the next few days.
XAG/USD 4-Hour Chart
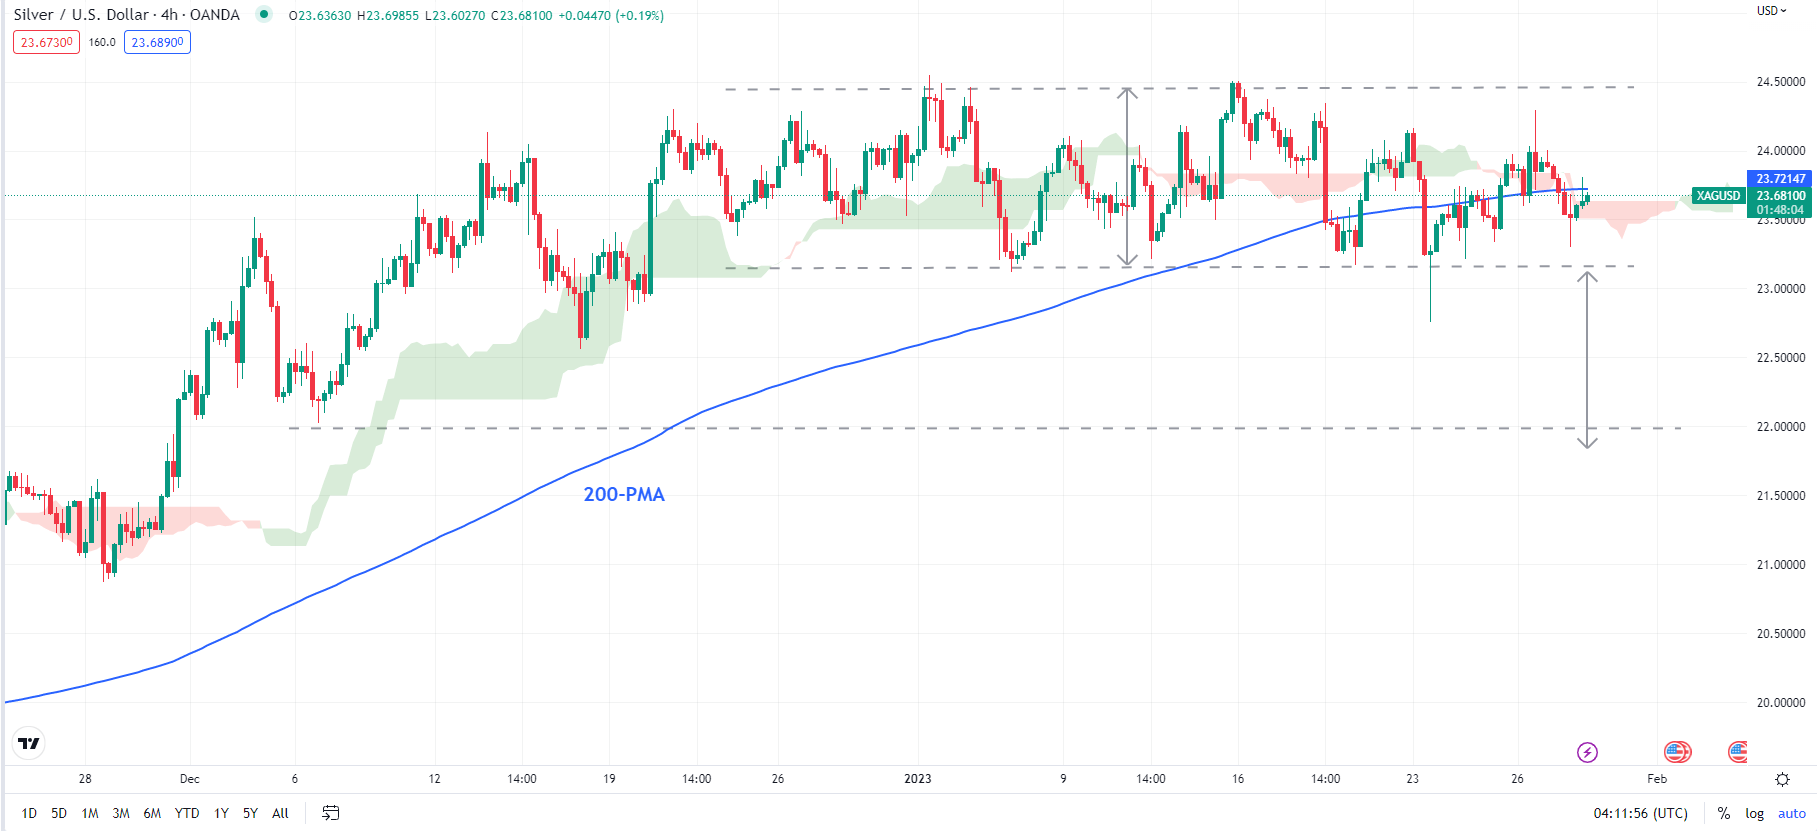
Chart Created Using TradingView
Ashighlighted last week, XAG/USD is weighed by a tough ceiling on a downtrend line from 2021. Despite the sharp rally since the end of 2022, the 14-week Relative Strength Index remains capped at around 60 – similar to the previous two rallies in Silver in 2021 and 2022.
There is the immediate support on a horizontal trendline from last week at about 23.10. A break below could pave the way toward quite a solid floor at the mid-December low of 22.50, roughly the price objective of the sideways topping pattern (see 4-hour chart).
--- Written by Manish Jaradi, Strategist for DailyFX.com