


Gold and Silver Q3 Technical Analysis
Over the last two months, Gold has been stuck in a well-defined daily range with neither buyers or sellers able to take control of price action. The daily Silver chart is different with a five-month series of higher-lows and higher-highs still in place, suggesting higher prices in the weeks ahead. Gold’s range and Silver’s trend both remain in place and may offer reliable set-ups for Q3.
Gold Q3 Technical Outlook
While traders normally look for a trend or a breakout pattern, a sideways range-trade can be just as profitable – potentially – as well as easy to control with noted areas of resistance and support. The daily Gold chart is currently showing a well-defined range that has held since early-April and this looks set to hold if both support and resistance remain in place. The CCI indicator (bottom of the chart) is in neutral territory, while a break above the 20- and 50-day smas would allow Gold to move back towards resistance. Support around the $2,277/oz. level has been tested in early-May and early-June and held, while the early-June pattern is currently mirroring the early-May rally. A break above the June 7th high at $2,387/oz. would suggest that the range trade remains in place.
Gold Daily Price Chart
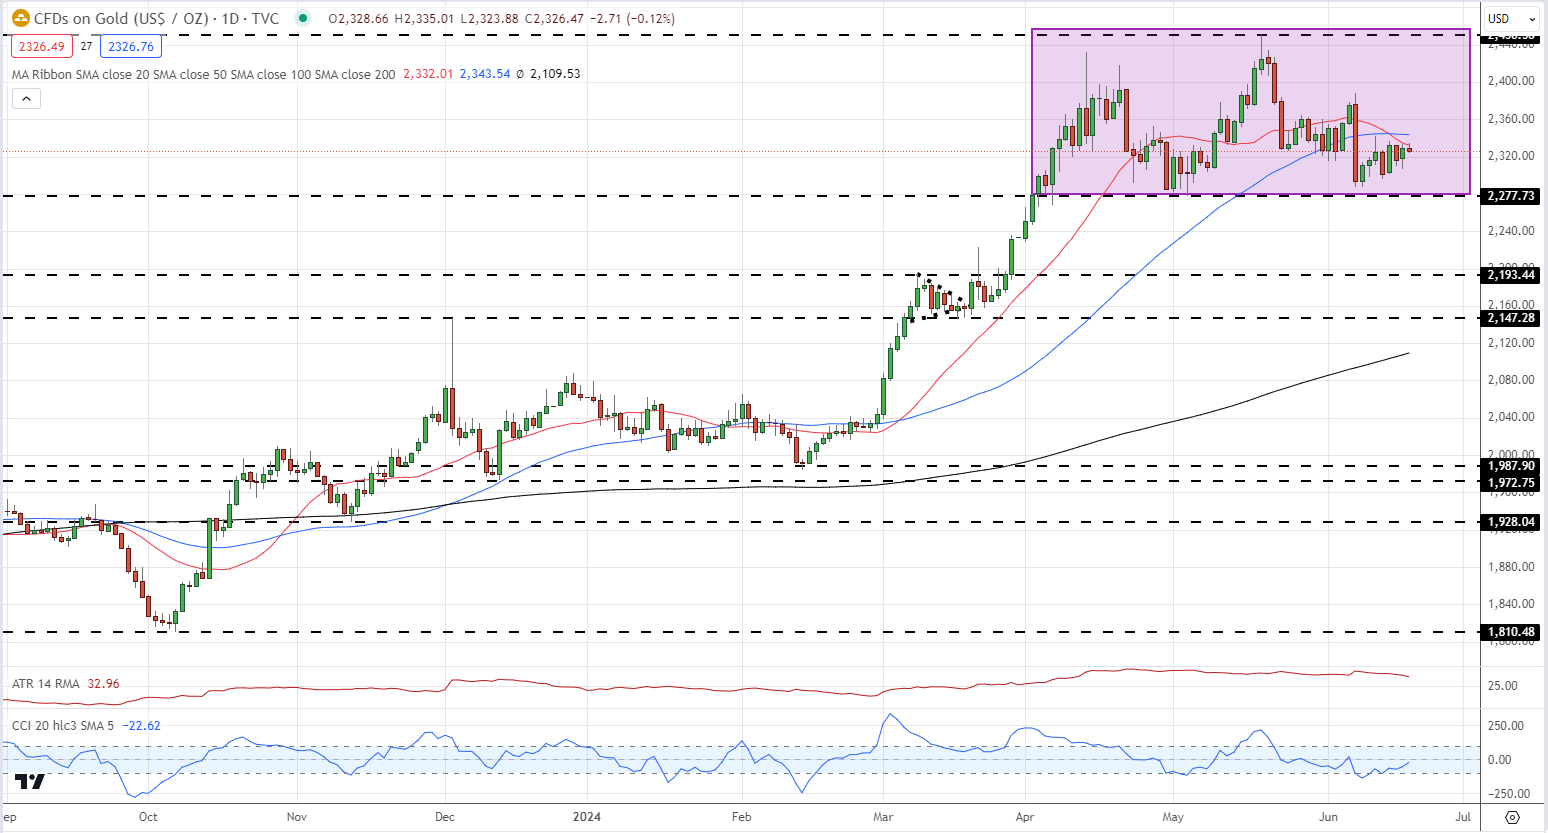
Chart via TradingView
After acquiring a thorough understanding of the technical backdrop for Gold and Silver in Q3, why not see what the fundamental landscape suggests by downloading the comprehensive Gold and Silver forecast for the third quarter?

Silver Q3 Technical Outlook
Silver is at an interesting point on the daily chart, continuing a multi-month pattern of higher-lows and higher-highs while also testing trend support. If trend support fails, then Silver may become trapped between $25.93/oz. and $29.80/oz. and start to build a range like gold. The CCI indicator is in neutral territory – Silver is neither overbought or oversold – while only the 20-day sma is in the way of higher prices. Trend support remains important if Silver is to move higher, and if it does then the precious metal may well test the recent double high around $32.48/oz.
Silver Daily Price Chart
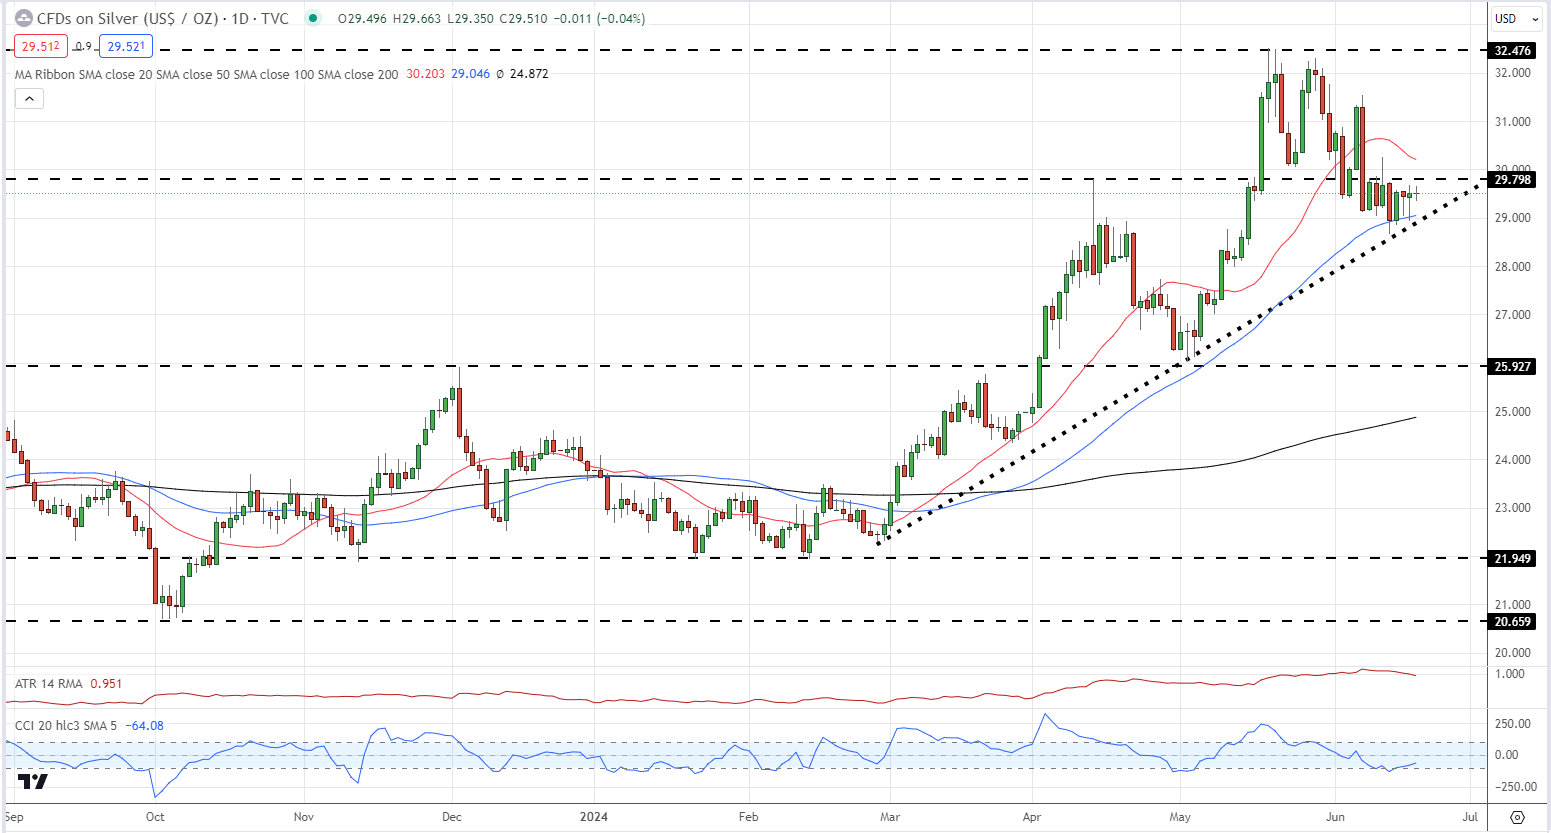
Chart via TradingView


