
Seng Index, Hong Kong Equities, HSI - Technical Outlook:
- Hang Seng continues to drift lower.
- However, the broader uptrend for HK/China stocks hasn’t reversed.
- What is near-term outlook and what are the key levels to watch?

HANG SENG INDEX TECHNICAL OUTLOOK - BULLISH
The gradual drift lower in the Hang Seng Index (HSI) reflects some of the unwindings of extreme overbought conditions. While the index could have a bit more downside in the near term, it is too soon to conclude that the uptrend has reversed.
The HSI index rose over 55% from a low of 14597 hit in October – the lowest level since the Great Financial Crisis. The 14-day Relative Strength Index rose above 80 at the end of January – the highest in two years. Levels above 70 are considered to be overbought and the closer the RSI goes toward 100, the more difficult it gets for a market to sustain the pace and the extent of the gains.
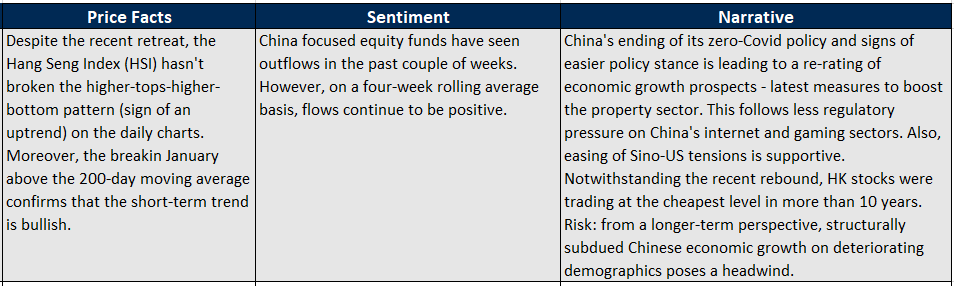
Price Facts, Sentiment, Narrative
On technical charts, the index has pulled back from quite a strong ceiling on a horizontal line from early 2022 (at about 22525), coinciding with the 89-week moving average. In the process, the index has fallen below minor support at the late-January low of 21383. The trend on intraday charts (hourly for instance) is down, and there is no sign of reversal yet.
Hang Seng Index Daily Chart

Chart created by Manish Jaradi using Metastock
However, on higher timeframe charts, including the daily charts, the index is consolidating within the four-month-long uptrend (highlighted in a recent update), as the color-coded candles show. Market breadth is still strong even after the retreat - 88% of the Hang Seng Index members are above their respective 100-DMA, and 64% of the members are above their respective 200-DMAs.
Hang Seng Index Daily Chart
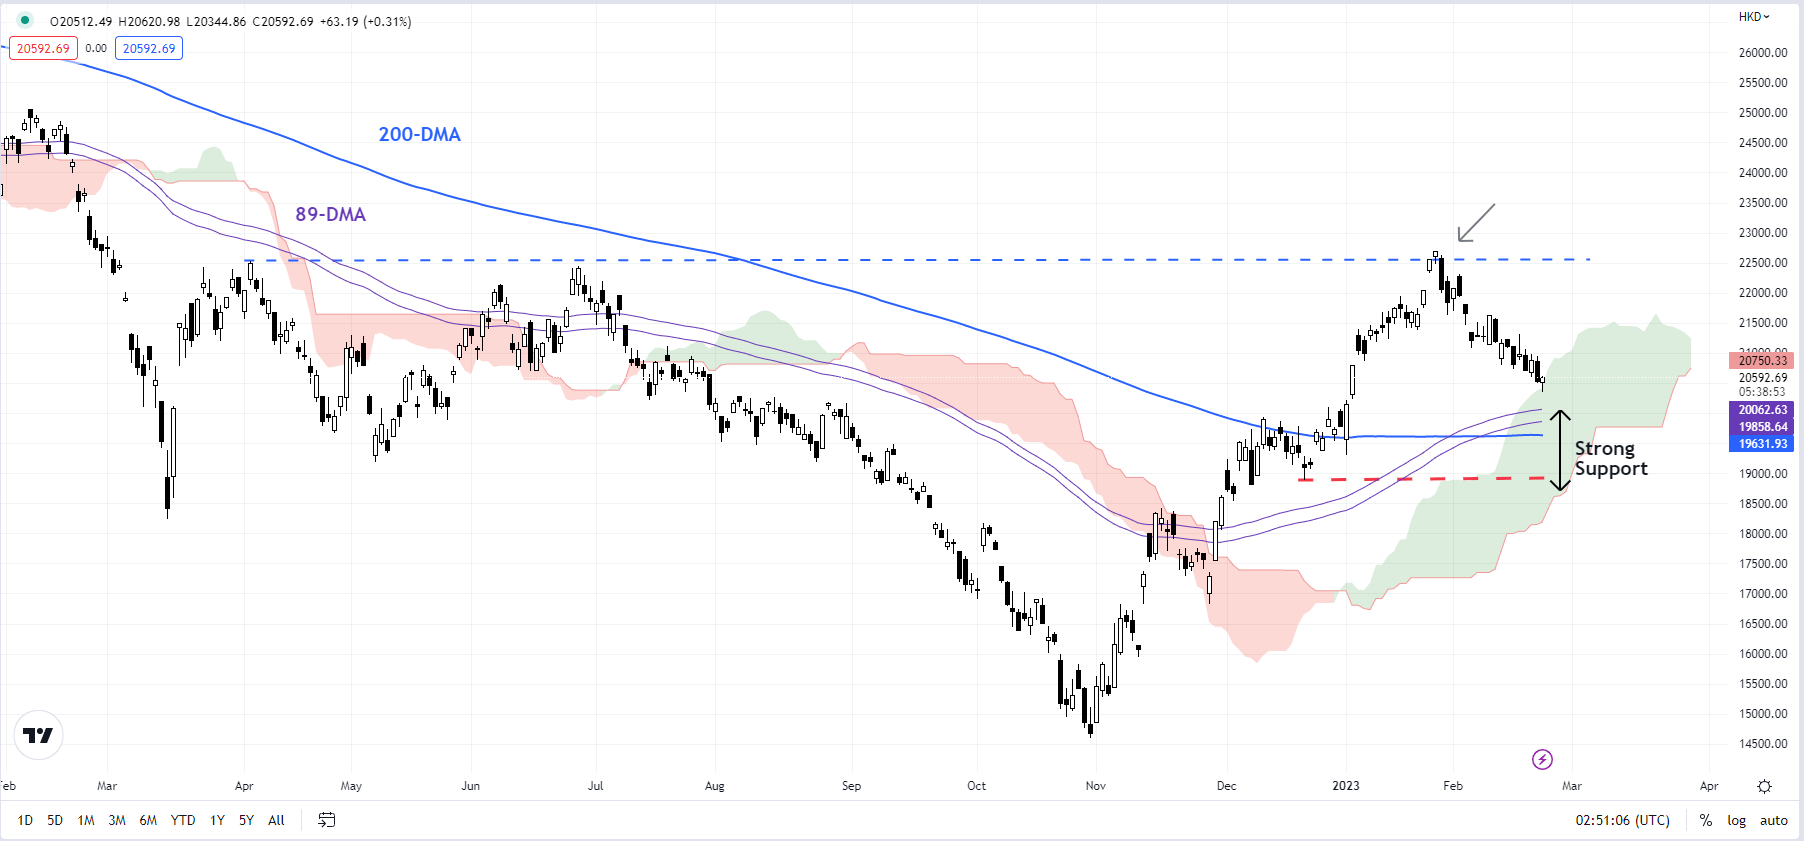
Chart created by Manish Jaradi using TradingView
The index is approaching a crucial converged support area: the early-December high of 19926, coinciding with the 89-DMA and the 200-DMA. Stronger support is on the lower edge of the Ichimoku cloud cover (now at about 18000), roughly around the late-December low of 18885. The downside could be contained within the 18885-19950 area. The index would need to break below 18885 for the four-month-long upward pressure to reverse.
Trade Smarter - Sign up for the DailyFX Newsletter
Receive timely and compelling market commentary from the DailyFX team
--- Written by Manish Jaradi, Strategist for DailyFX.com