
HANG SENG, HK Equities, HSI - Technical Outlook:
- The Hang Seng Index’s upward momentum appears to be strong.
- However, the upside could be capped.
- What is the short-term outlook and what are the key levels to watch?

HANG SENG INDEX SHORT-TERM TECHNICAL OUTLOOK - NEUTRAL
Strong momentum in recent days raises the possibility of an extended pause in the Hang Seng Index’s multi-month slide. However, the index’s upside could be capped.
The rebound has well surpassed the initial price objective of 17050 pointed out in the previous update. The rise earlier this month above a minor horizontal trendline from the end of October (at about 15800) triggered a minor reverse head & shoulders pattern (the left shoulder at the October 25 low, the head at the October 31 low, and the right shoulder at the Thursday low). The price objective of the pattern works out to about 17050.
Hang Seng Index Hourly Chart
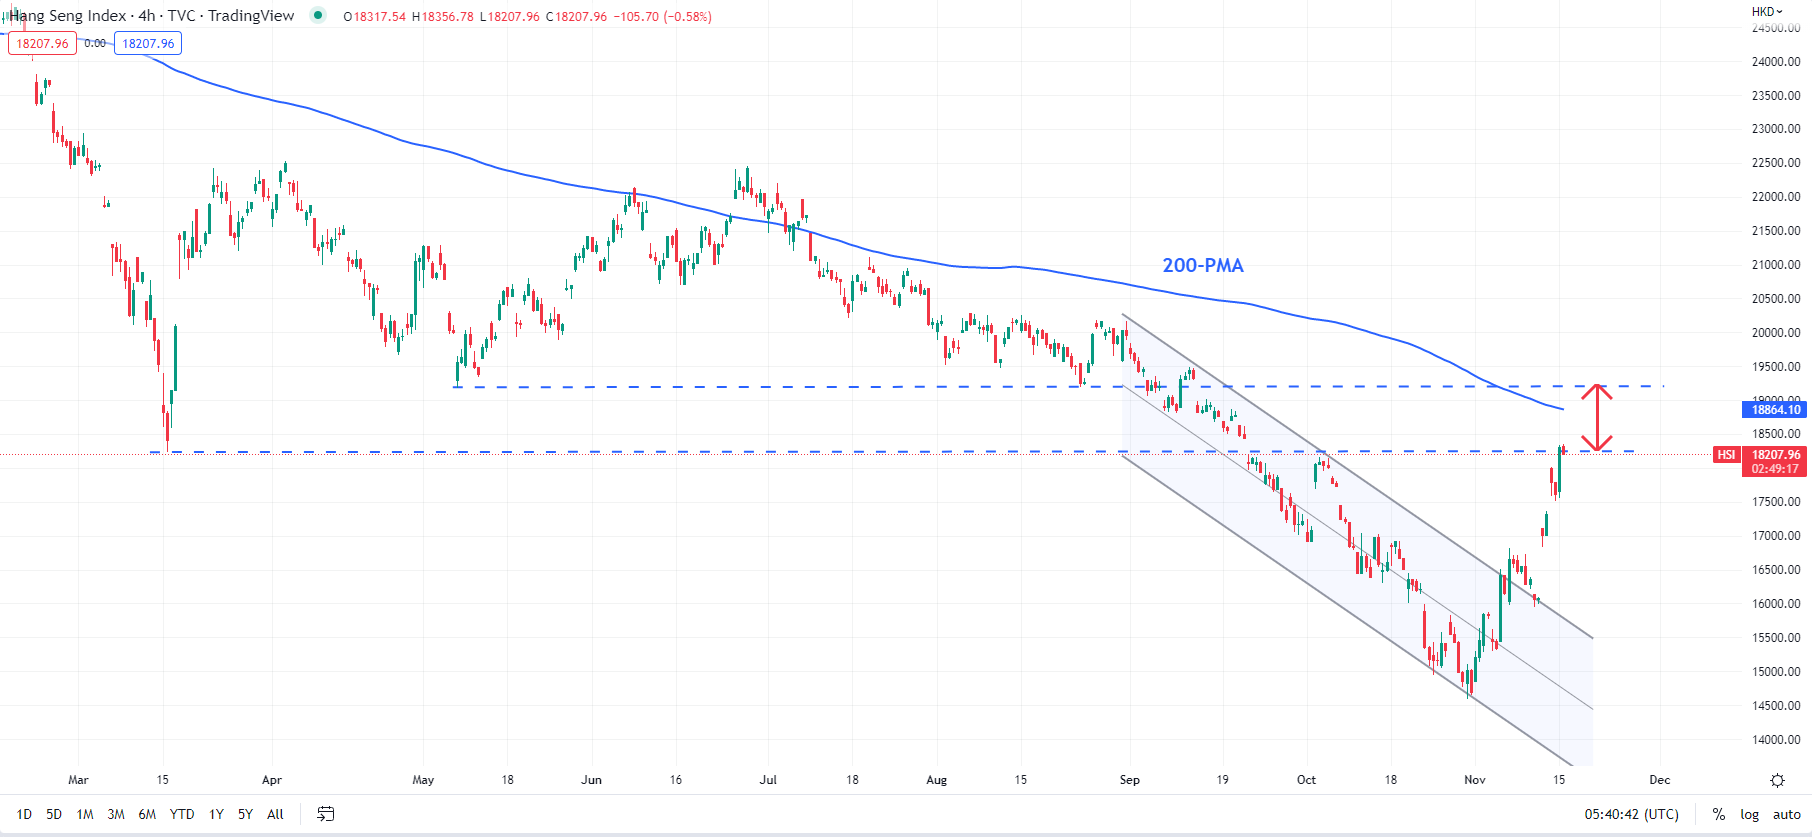
Chart Created Using TradingView
The index is now testing a stronger converged barrier at the March low of 18235, coinciding with the early-October low. Strong momentum on intraday charts raises the scope of some more gains in the near term, potentially toward the 200-period moving average on the 240-minute chart, slightly below the May low of 19180. Overall, the area of 18235-19180 appears to be strong resistance and could cap the rebound.
The sharp gains this month raises the prospect of a meaningful corrective rally, but probably not enough to suggest a reversal of the downtrend. In this regard, the medium-term downward pressure is unlikely to ease while the index remains below the 200-day moving average (now at about 20300).
Hang Seng Index Monthly Chart
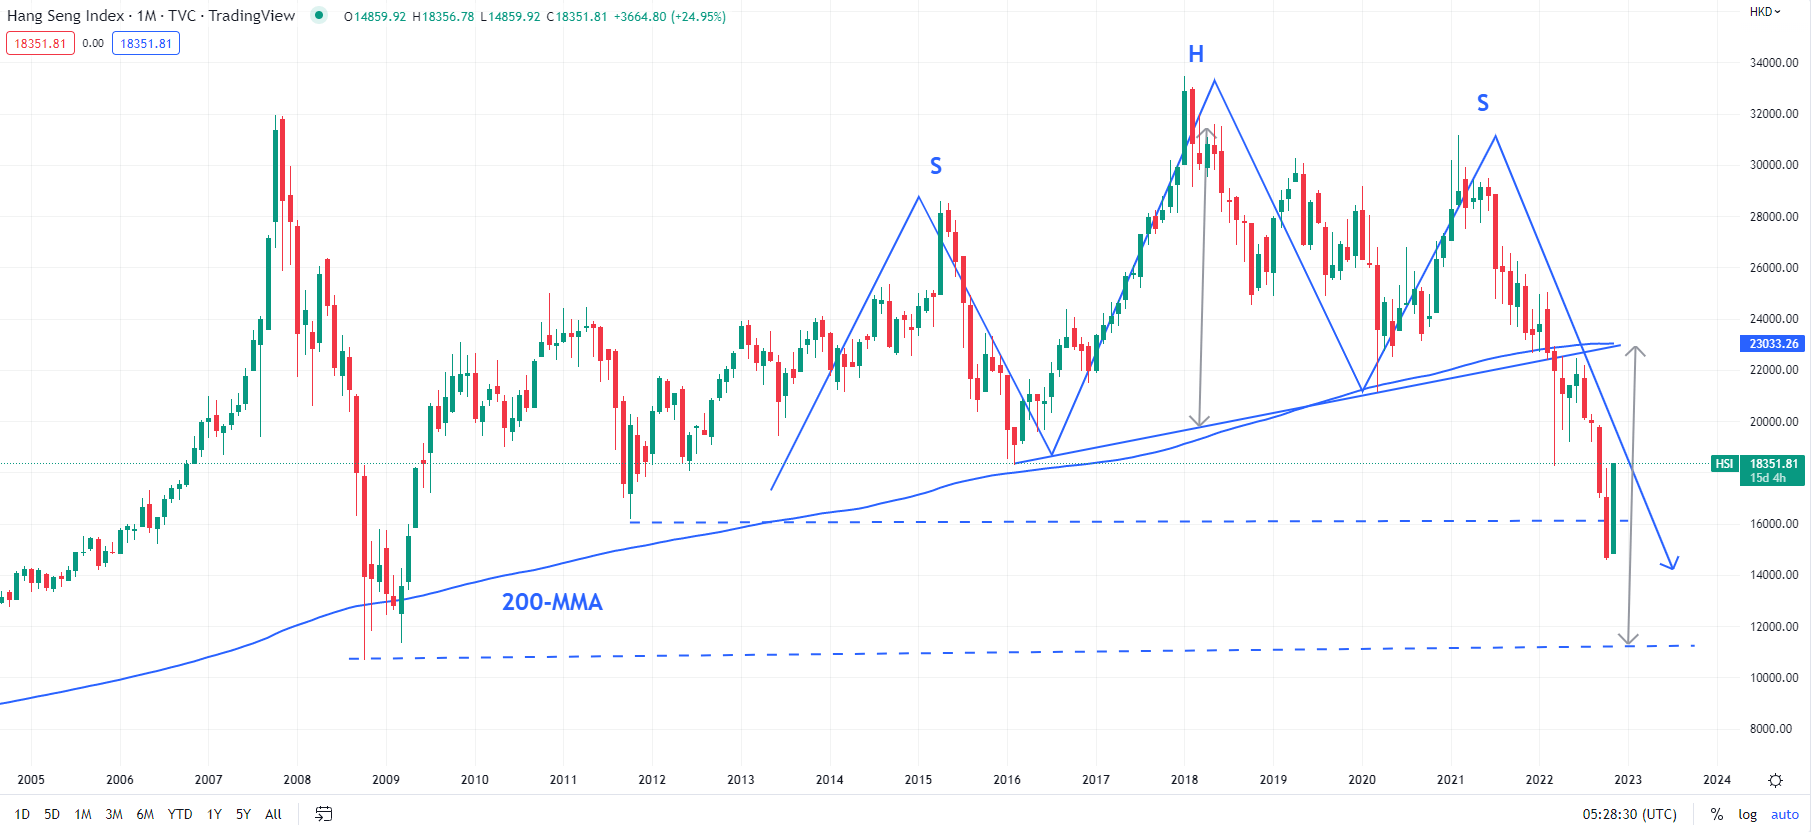
Chart Created Using TradingView
The broader trend remains down as reflected by the negative Moving Average Convergence Divergence indicator (MACD) on the weekly, monthly, and quarterly charts. A negative reading of the MACD signifies a downtrend and vice versa. The downtrend in the Hang Seng Index has accelerated this year after it fell below an uptrend line from 2016 (that came at about 22600). The break triggered a major head & shoulders pattern (the left shoulder is at 2015 high, the head is at 2018 high, and the right shoulder is at 2021 high), implying a potential move towards the Great Financial Crisis low of 10676. The index fell to 14597 at the end of last month before rebounding.

--- Written by Manish Jaradi, Strategist for DailyFX.com