Japanese Yen, USD/JPY, Technical Analysis, Retail Trader Positioning – IGCS Update
- Japanese Yen weakens to softest since November
- Retail traders are already strongly bearish USD/JPY
- Is this a sign that the exchange rate may rise?

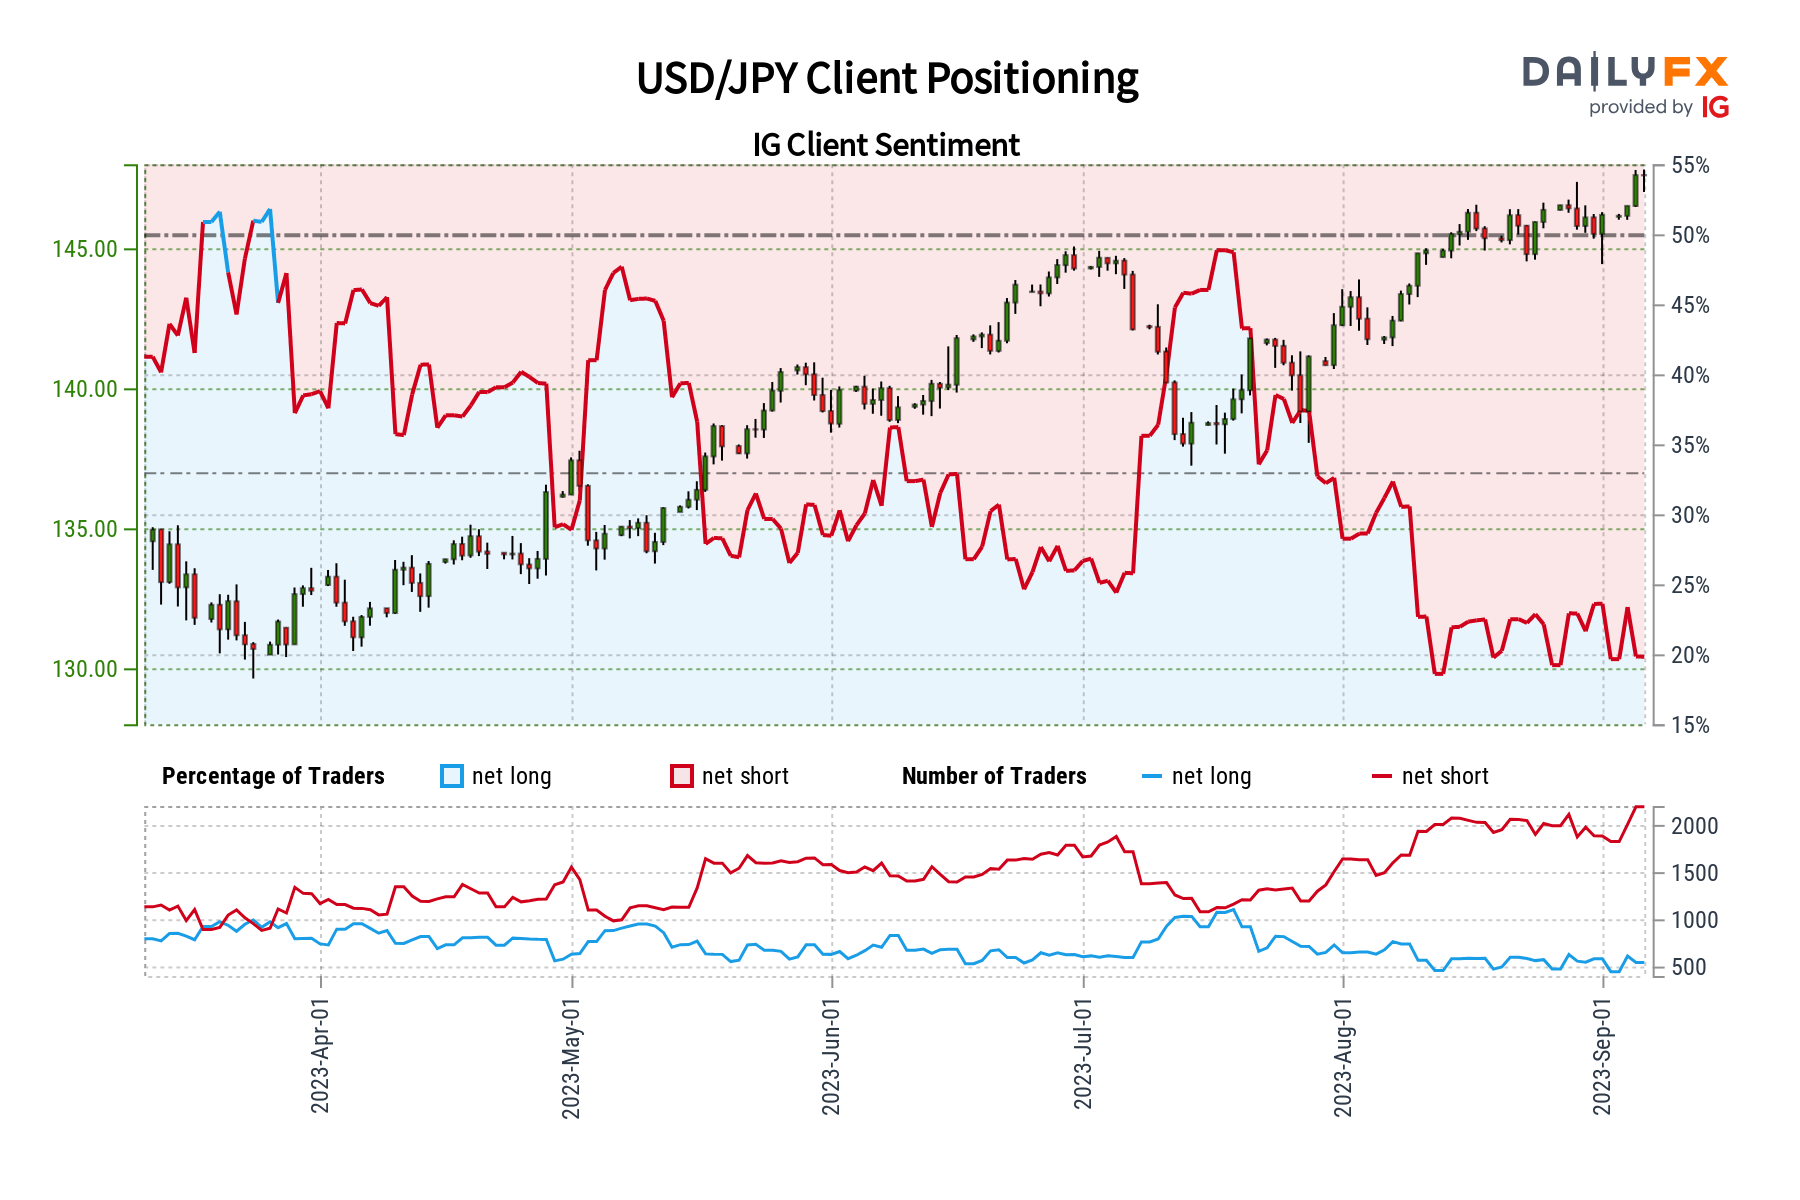
The Japanese Yen closed at its weakest against the US Dollar since early November after USD/JPY soared the most since late July. In response, retail traders have increased downside exposure in the exchange rate. This can be seen by taking a look at IG Client Sentiment (IGCS), which often functions as a contrarian indicator. With that in mind, will USD/JPY extend higher next?
USD/JPY Sentiment Outlook – Bullish
The IGCS gauge shows that only about 20% of retail traders are net-long USD/JPY. Since an overwhelming majority of them are biased to the downside, this is offering a bearish outlook for the broader horizon. Meanwhile, downside bets have increased by 3.72% and 7.4% compared to yesterday and last week, respectively. With that in mind, overall positioning and recent changes produce a stronger bullish contrarian trading bias.
| Change in | Longs | Shorts | OI |
| Daily | -3% | -6% | -5% |
| Weekly | 20% | -7% | -2% |
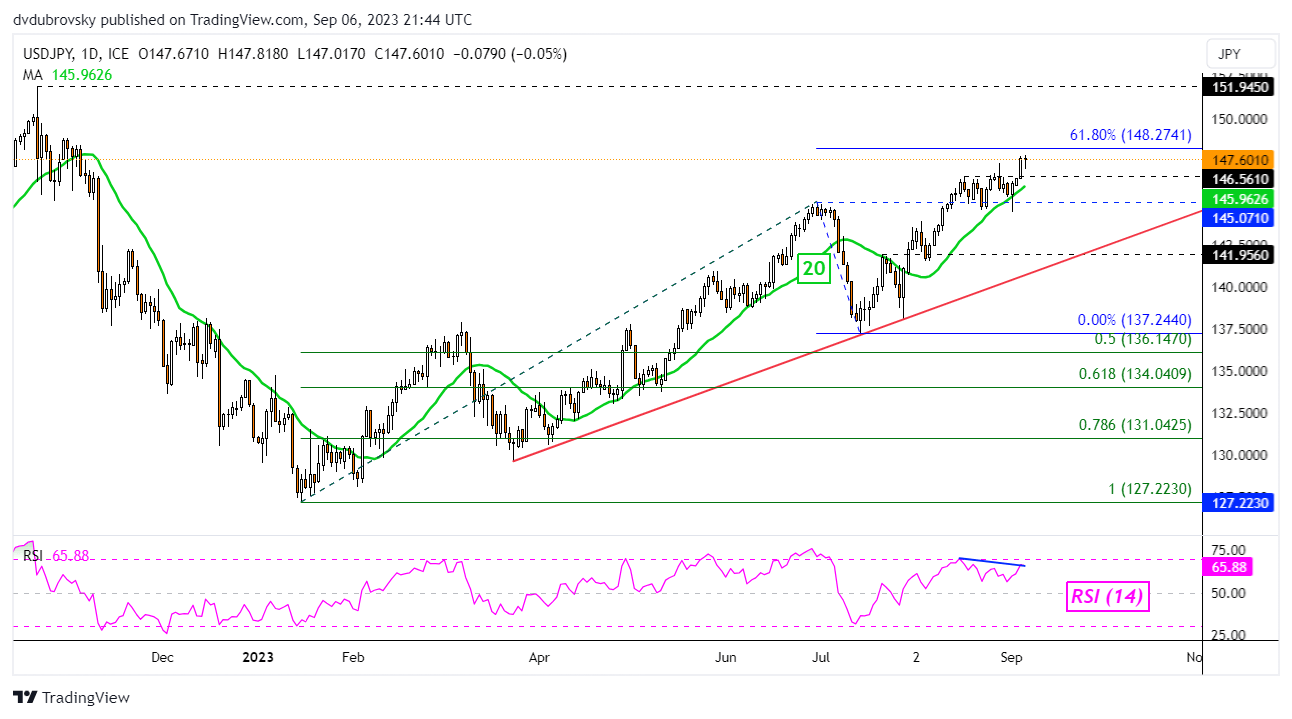
Japanese Yen Daily Chart
Taking a look at the daily chart below, USD/JPY has closed above 146.56, a key resistance point established throughout August. The breakout opens the door to resuming what has been the broader uptrend since the beginning of this year. Immediate resistance from here is the 61.8% Fibonacci extension level at 148.27. Pushing beyond that exposes last year’s peak of 151.94.
Keep in mind that negative RSI divergence is brewing. While prices have set higher highs, the momentum indicator has not. This can at times precede a turn lower. Such an outcome places the focus on the 20-day Moving Average, which can function as support, maintaining the upside technical focus. Otherwise, further losses would place the focus on rising support from March.

--- Written by Daniel Dubrovsky, Senior Strategist for DailyFX.com