

Japanese Yen, USD/JPY, US Dollar, EUR/JPY, Euro, CHF/JPY, Swiss Franc - Talking Points
- USD/JPY fell from the clouds earlier this month and might push lower
- EUR/JPY and CHF/JPY have similar set-ups as they settle into a range for now
- If the Yen keeps strengthening, have we seen the peak for USD/JPY?

USD/JPY TECHNICAL ANALYSIS
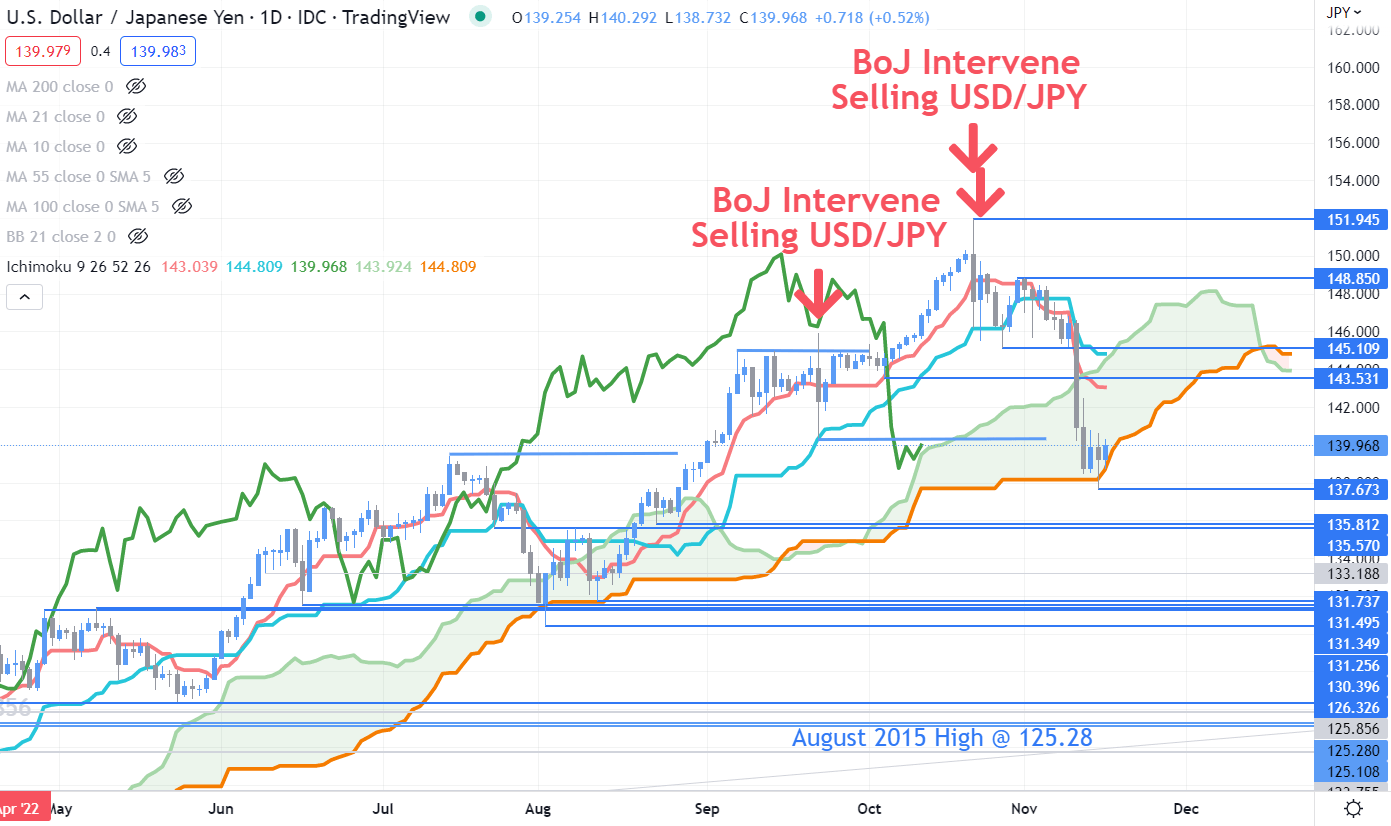
USD/JPY has moved down into the Ichimoku Cloud and a break under it could signal an end to the bullish run. This may indicate a possible bearish trend unfolding.
Support could be at the previous lows of 137.67 and 135.81 or at the breakpoint of 135.57.
Previous support levels that have been broken might now offer breakpoint resistance at 143.53 and 145.11. Further up, resistance could be at the previous peaks of 148.85 and 151.95

EUR/JPY TECHNICAL ANALYSIS
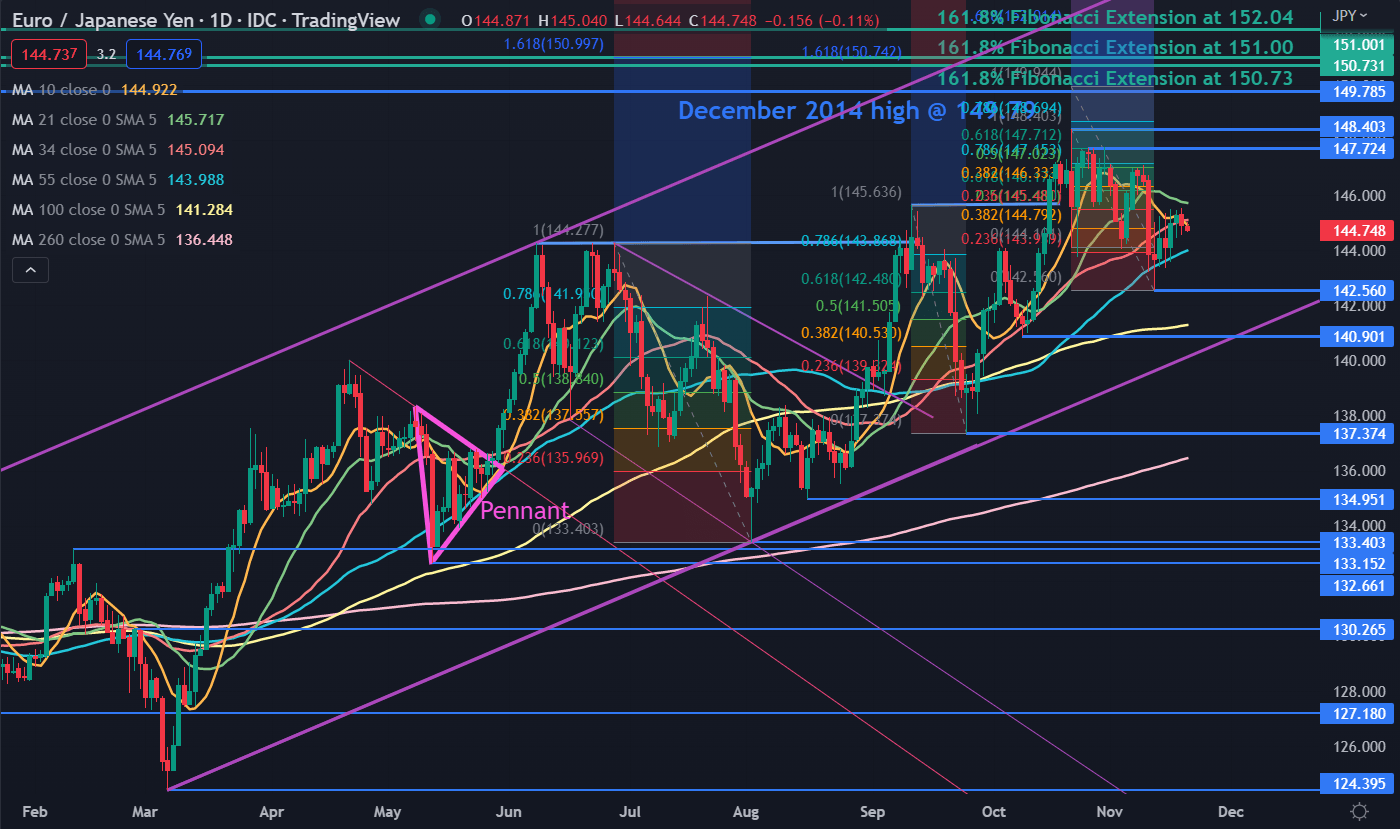
EUR/JPY appears to be setting up a range trading environment having been contained between 142.56 and 148.40 for over a month.
The price has crisscrossed the 10-, 21- and 34-day Simple Moving Averages (SMA) several times, potentially indicating a lack of short-term directional momentum.
The 55-, 100- and 260-day SMAs remain below the price and display positive gradients. This could signal that underlying medium and long-term bullish momentum might be intact.
The bigger-picture ascending trend channel is also intact. Support may lie at the previous lows of 142.56, 140.90 and 137.37.
On the topside, resistance could be offered at the recent highs of 147.72 and 148.40 ahead of the December 2014 peak of 149.79.
Beyond there, a series of Fibonacci Extension levels may offer resistance at 150.73, 151.00 and 152.04.

CHF/JPY TECHNICAL ANALYSIS
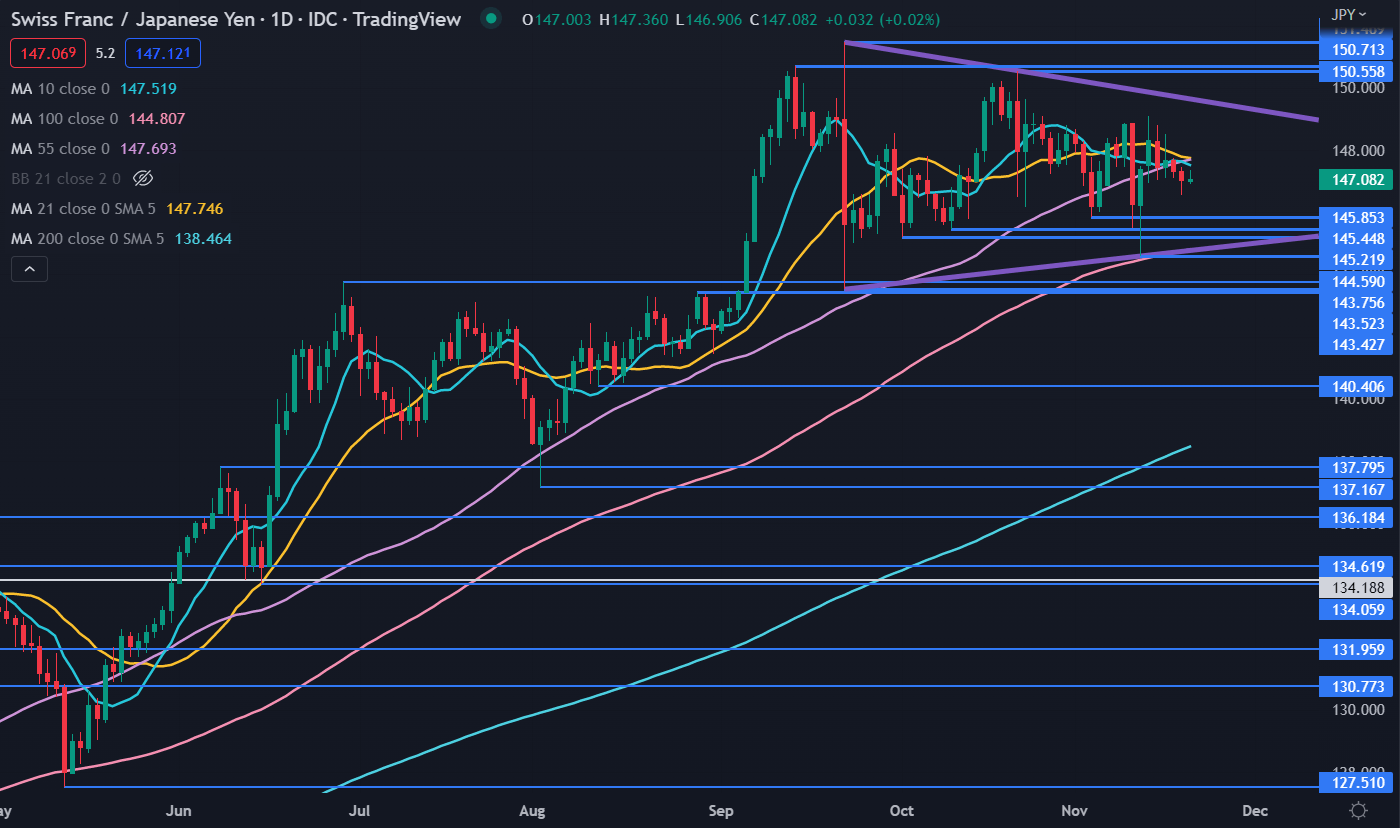
Similar to EUR/JPY, CHF/JPY has been in a 143.52 – 151.47 range for 11 weeks.
The currency pair has also crisscrossed the 10-, 21- and 55-day SMAs several times recently and this may suggest that there is a lack of directional momentum.
Likewise, the price remains above the 100- and 200-day SMAs that have positive gradients, which could hint that underlying bullish momentum persists.
The 100-day SMA is currently at the same level as an ascending trend line at 144.81 which might provide support. Above there, three breakpoints at 145.22, 145.45 and 145.85 may lend support.
Further down, the prior lows of 144.59 and 143.53 could provide support.
On the topside, a breakpoint and two previous peaks might offer resistance at 150.56, 150.71 and 151.47. Ahead of those, a descending trend may provide resistance, currently at 149.60.
--- Written by Daniel McCarthy, Strategist for DailyFX.com
To contact Daniel, use the comments section below or @DanMcCathyFX on Twitter