Dow Jones, Nasdaq 100, Nikkei 225 Analysis and Charts
Dow higher, but still below record high
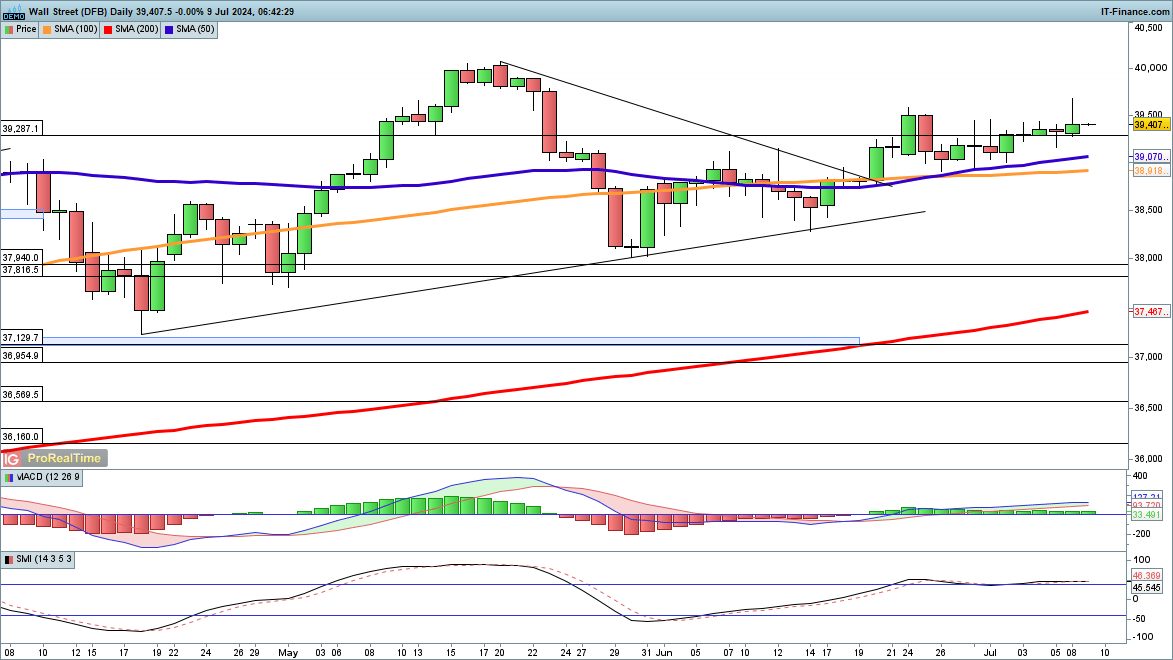
The index has edged higher over the past week, but an attempt to make strong gains yesterday was knocked back. This contrasts with the S&P 500 and the Nasdaq 100, which continue to make new highs. It is important to note that the index is still just 1.7% off its record highs from May, though its performance this year is not as strong as the other two US indices.
A close above 39,500 could help to trigger a new move higher, opening the way to the previous record high. Recent gains have been underpinned by the 50-day simple moving average (SMA), so a close below this (currently 39,070) might signal that some short-term weakness is ahead.
Dow Jones Daily Chart
| Change in | Longs | Shorts | OI |
| Daily | 1% | -2% | -2% |
| Weekly | -26% | 15% | 2% |
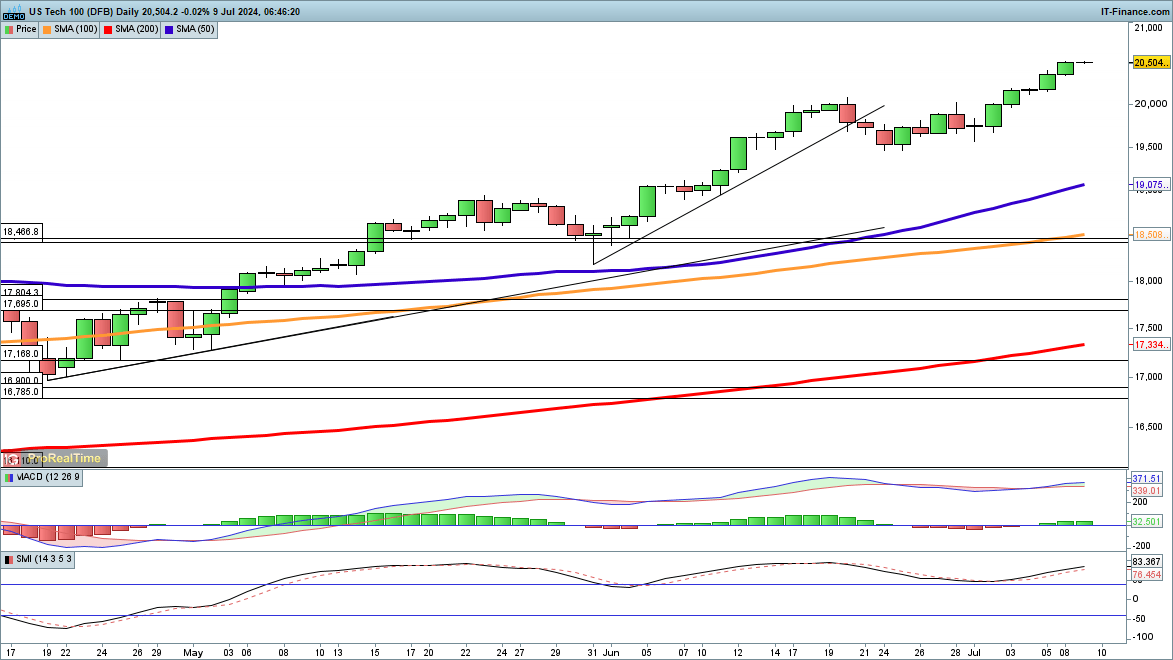
Nasdaq 100 rally continues
The past week has seen the index march higher, moving through 20,000, with no sign of a reversal as yet. Money continues to flow into the big-name tech stocks, which have driven the index, and the S&P 500, to new highs over the past week. While the price continues to move away from the 50-day SMA (currently 6.9% away), the buyers remain firmly in charge.
In the short-term, a close back below the mid-June high at 20,000 might indicate that at least a short-term pullback is on the cards.
Nasdaq 100 Daily Chart
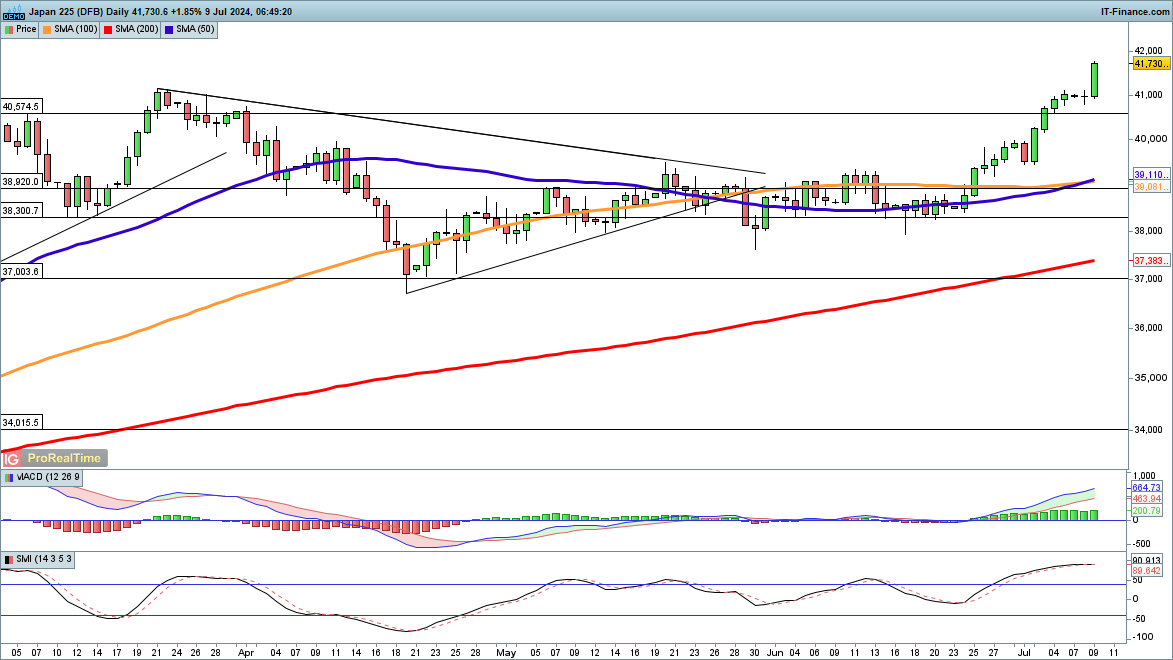
Nikkei 225 hits new high
The Nikkei’s gains accelerated overnight, hitting a fresh high and moving through 41,000 for the first time. Bullish momentum may continue to carry the index higher, though Jerome Powell’s testimony today and Thursday’s US inflation data might provoke some volatility.
Sellers have been firmly shut out of this index over the past three weeks, though a close below the previous high at 40,574 might indicate that the price has moved into a consolidation phase.
Nikkei 225 Daily Chart