
Nasdaq 100, Dow Jones 30, CAC40 Analysis and Charts
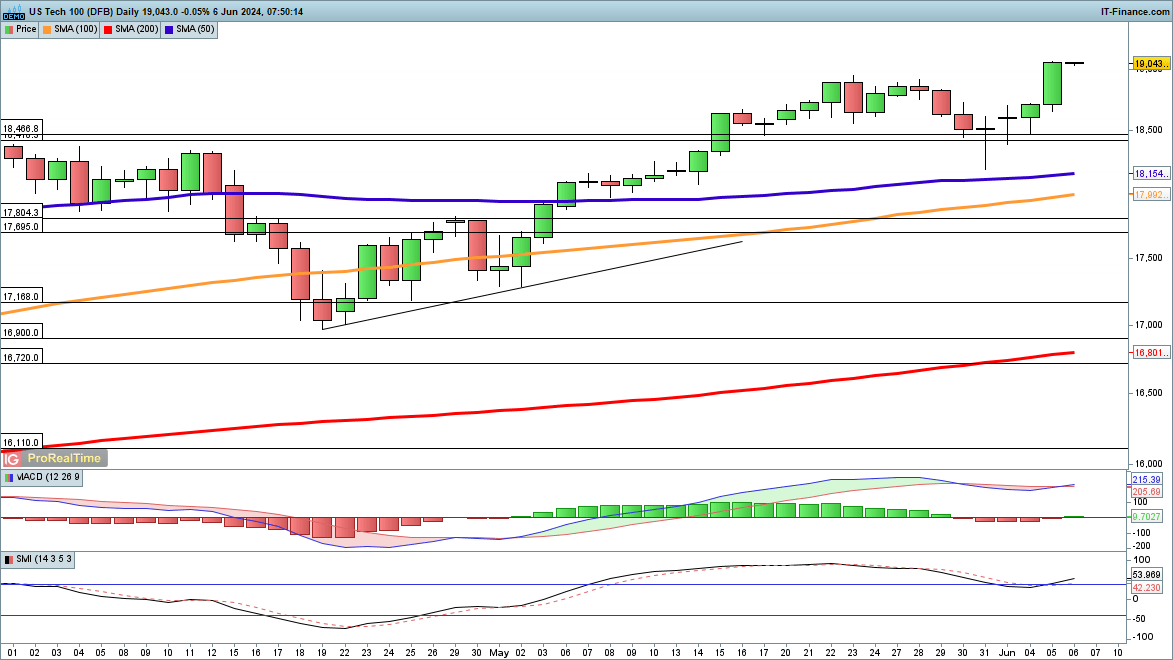
Nasdaq 100 at new record
The index climbed to a new record high on Wednesday, rallying through the 19,000 level for the first time.This follows on from a bounce from the lows of last week, when the price rallied from a low at 18,187, near the 50-day SMA.
In the short term, momentum may carry the price further beyond 19,000. A close back below 18,700 would be needed to put a more substantial dent in the outlook.
Nasdaq 100 Daily Chart


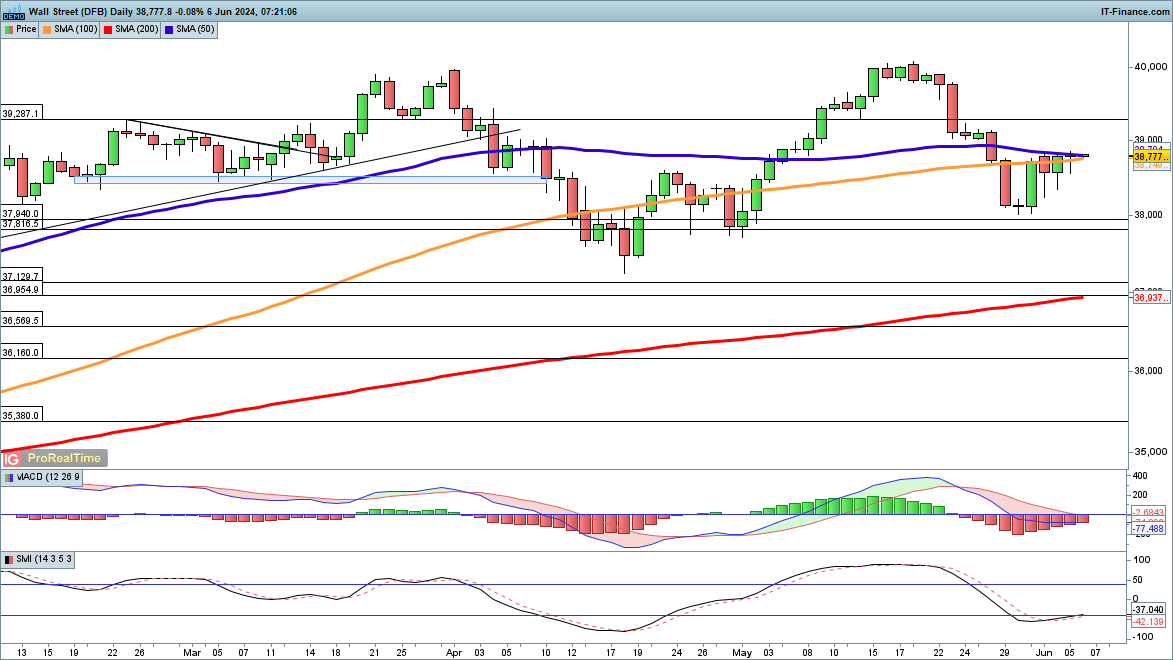
Dow rallying from higher low
A fresh higher low appears to have formed after the price rebounded from 38,000 at the end of last week.The price returned to the 50-day simple moving average yesterday, and a close above the 50-day SMA would reinforce the bullish view and would then open the way to the record highs at 40,000.
A close back below 38,500 would then suggest that a retest of 38,000 may follow, and below this lies the April low at 37,236.
DowJones 30 Daily Chart
| Change in | Longs | Shorts | OI |
| Daily | 11% | 3% | 6% |
| Weekly | -13% | 4% | -3% |
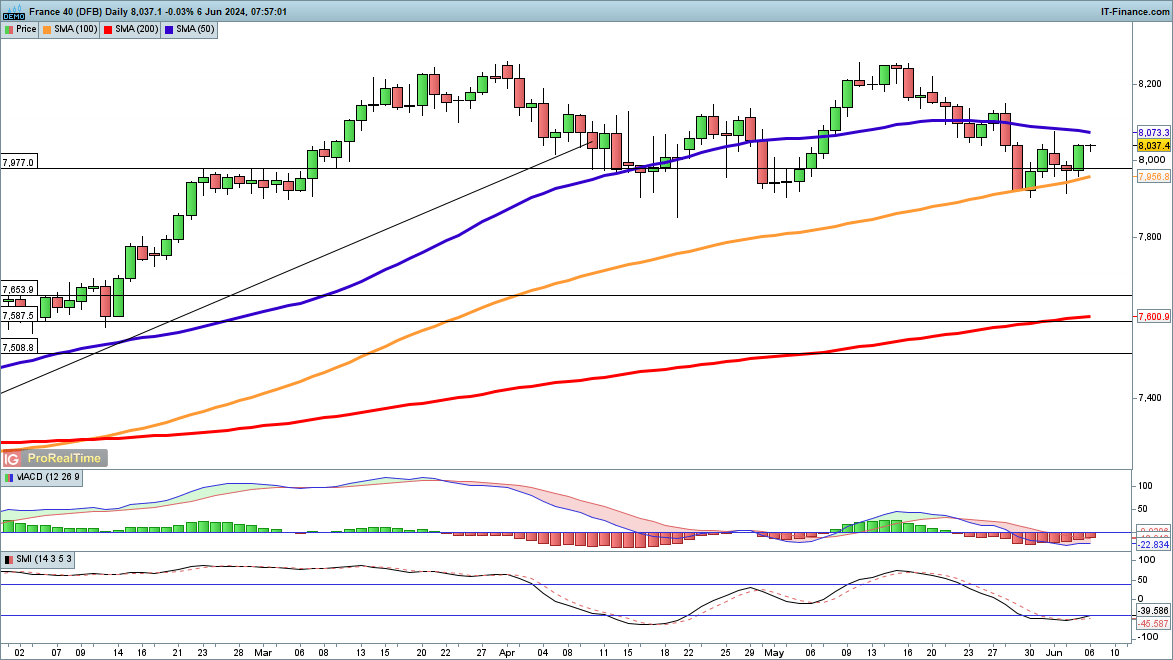
CAC 40 moves off support
Over the past week the index formed a low around 7900, as it did in April and May.Should this low continue to hold, then we can look towards a fresh rebound towards the 8250 highs from April and May, reviving the uptrend. From there new record highs loom.
CAC 40 Daily Chart