

Natural Gas, Fading Momentum, Falling Wedge – Technical Update:
- Natural gas prices reversed initial losses accumulated last week
- Downside momentum continues to fade on the daily and weekly
- Falling Wedge breakout still needs further confirmation, where to?
Trade Smarter - Sign up for the DailyFX Newsletter
Receive timely and compelling market commentary from the DailyFX team
Weekly Chart – Momentum Continues Fading
Natural gas prices finished last week on a positive note, despite being unchanged from the week before. That is because the heating commodity managed to reverse losses accumulated throughout the 5 trading days to finish Friday on an upbeat. This continues to paint the story that downside momentum is fading. That can be seen by looking at RSI, which is displaying positive divergence. This can at times precede turning points within downtrends.
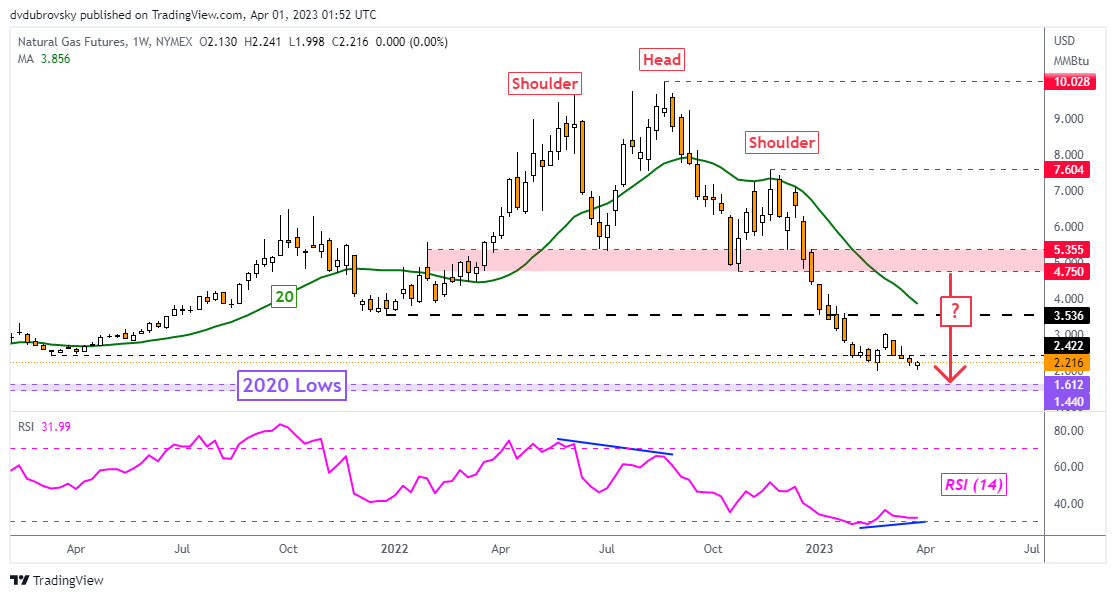
Chart Created Using TradingView
Daily Chart – Eyes on 50-Day SMA
On the daily setting, we can see that natural gas reinforced key support, which is the February low at 1.967. That is because prices were unable to clear this point last week. Note that positive RSI divergence also exists on the daily chart. As such, the heating commodity could be looking at setting the stage for a turn higher. That would place the focus on the 50-day Simple Moving Average (SMA), which is immediate resistance. This could reinstate the downside focus, pivoting prices back to support. Otherwise, extending beyond the line exposes the March high at 3.027.
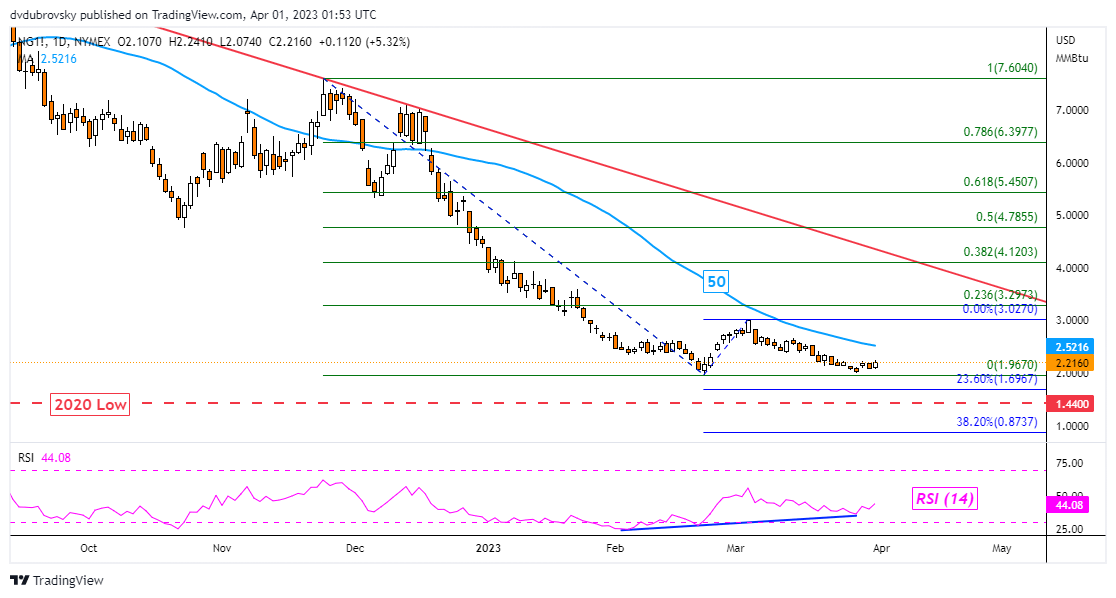
Chart Created Using TradingView
4-Hour Chart – Wedge Breakout
Zooming in once again and pulling up the 4-hour chart, we can take a closer look at how natural gas is shaping up for the week ahead. For starters, prices have confirmed a breakout above a Falling Wedge chart formation. Although, upside progress has been somewhat lackluster. That is because the 78.6% Fibonacci retracement level at 2.195 held as resistance. Breaking above this price could reinstate the bullish implications of the wedge, exposing the 100-period SMA. If the latter does not hold, it could be shaping up for a bullish week ahead.

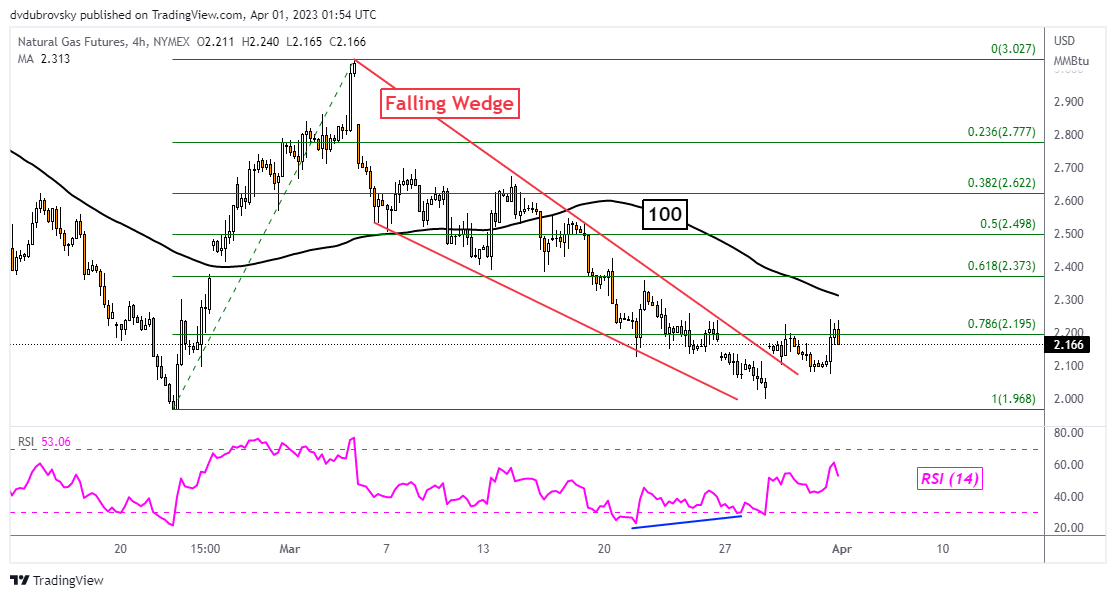
Chart Created Using TradingView
--- Written by Daniel Dubrovsky, Senior Strategist for DailyFX.com
To contact Daniel, follow him on Twitter:@ddubrovskyFX