
Natural Gas, Hanging Man, RSI Divergence, Rising Wedge – Technical Update:
- Natural gas prices have been rising lately, is the trend shifting?
- Daily chart shows there is still some indecision as prices climb
- 4-hour chart reveals upside momentum is fading, eyes on wedge
Trade Smarter - Sign up for the DailyFX Newsletter
Receive timely and compelling market commentary from the DailyFX team
Daily Chart – Hanging Man in Focus
Natural gas prices are heading for a 2-week gain of 7.81 percent. If confirmed, that would be the best performance since the end of October. Is recent price action showing more signals that the heating element has bottomed?
Traders with a longer time horizon would likely continue seeing the broader trend as bearish. At the end of the day, there is a long-term falling trendline from August that is maintaining the downside bias – the red line on the daily chart below. Getting to that line will take considerable upside progress. Still, that does not mean that the near-term bias isn't shifting bullish.
Prices have confirmed a breakout above the 20-day Simple Moving Average (SMA). That is increasingly shifting the immediate outlook to a more bullish setting. Still, on Tuesday, prices left behind a Hanging Man candlestick pattern. The latter is a sign of indecision. Downside progress thereafter could be a sign that prices are ready to resume lower.
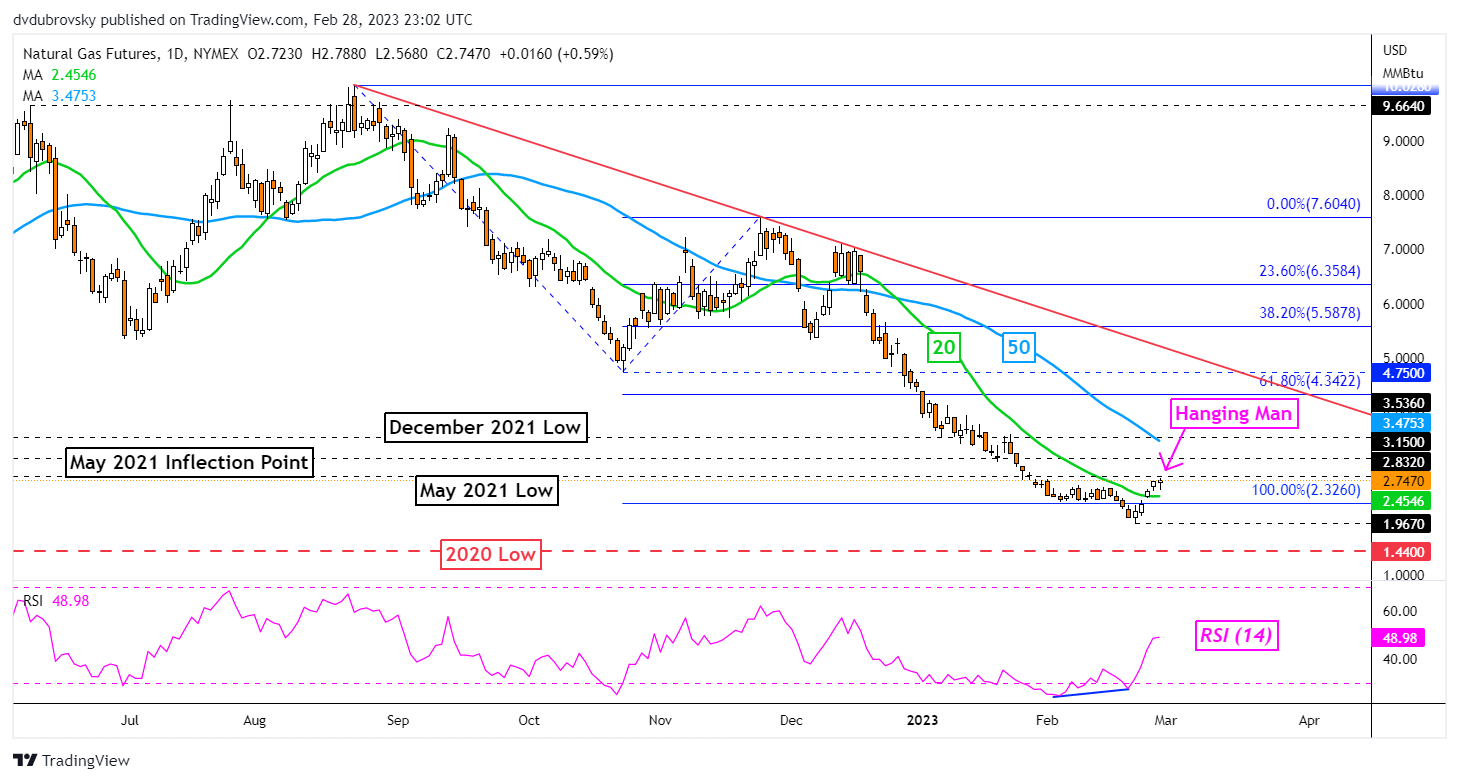
Chart Created Using TradingView
4-Hour Chart – Upside Momentum Fading Within a Rising Wedge
Zooming in on the 4-hour timeframe, natural gas has confirmed the highest close since late January. Prices also took out the former ceiling of a rectangle that was established earlier this month. That price level was 2.657. Immediate resistance is now the midpoint of the Fibonacci retracement at 2.782. Confirming a breakout above that price would open the door to extending higher.
Still, a bearish Rising Wedge continues brewing. While prices remain inside the boundaries of the chart formation, the immediate bias might remain tilted higher. However, negative RSI divergence shows that upside momentum is fading. That can at times precede a turn lower. If that translates into a breakout under the wedge, natural gas could find itself resuming the broader downtrend once more.

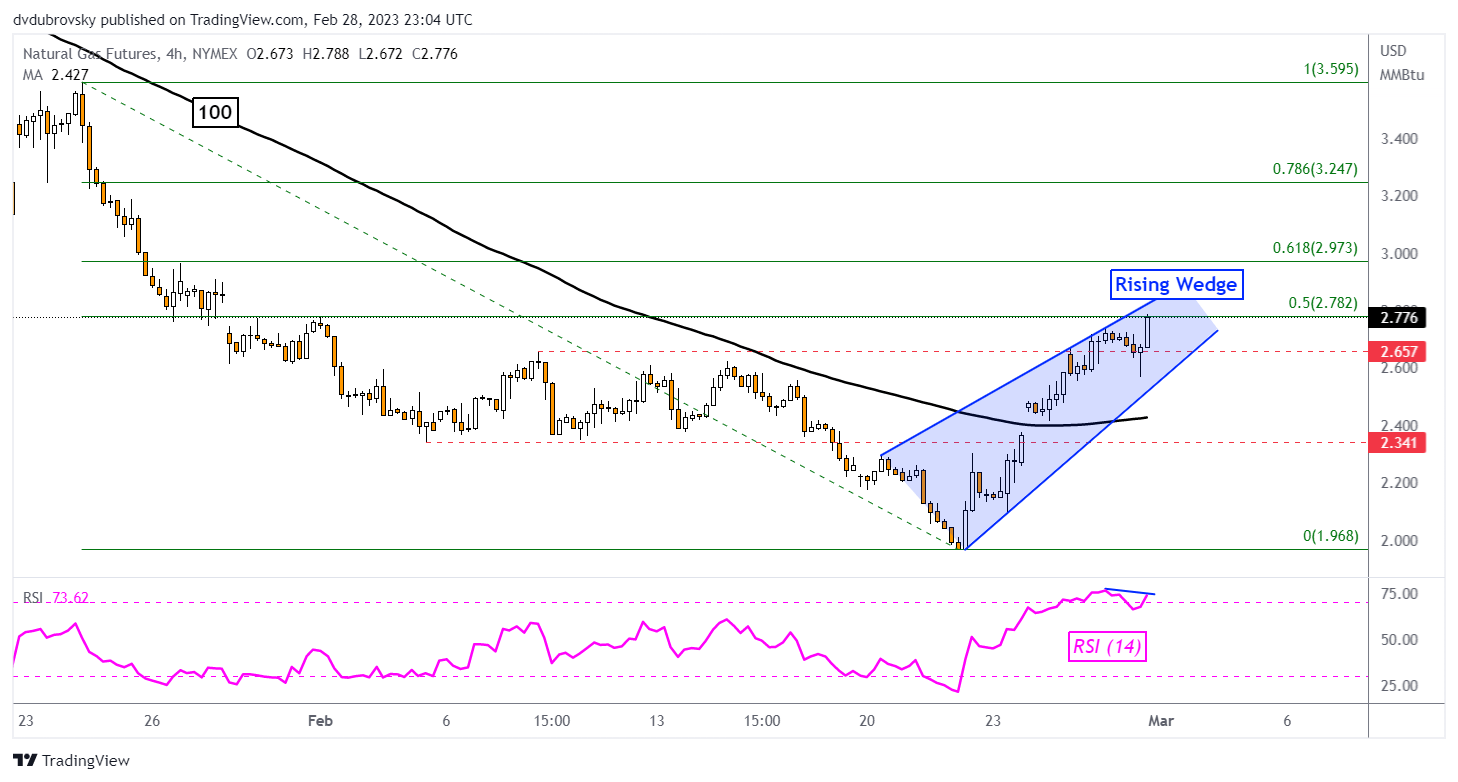
Chart Created Using TradingView
--- Written by Daniel Dubrovsky, Senior Strategist for DailyFX.com
To contact Daniel, follow him on Twitter:@ddubrovskyFX