

Natural Gas, 50-Day SMA, Rising Wedge Breakout – Technical Update:
- Natural gas prices conclude the longest win streak since February
- The 50-day SMA held as resistance, maintaining the bearish focus
- 4-hour chart shows a breakout under a Rising Wedge is in play
Trade Smarter - Sign up for the DailyFX Newsletter
Receive timely and compelling market commentary from the DailyFX team
Daily Chart – 50-Day Simple Moving Average Holds
Natural gas prices fell over 6% on Wednesday, ending a 3-day winning streak which was the longest since the end of February. Leading into the 3-day rise, positive RSI divergence was showing that downside momentum was fading. That can at times precede a turn higher. But, it seems broader downside forces remain in focus for the heating commodity.
Prices were unable to push above the 50-day Simple Moving Average (SMA). This has been maintaining the broader downside technical bias since December. In fact, December was the last time we saw natural gas above the 50-day line. As such, the focus is now being shifted back to the February low at 1.967 if prices continue lower in the coming sessions.
Breaking under this support would expose the 23.6% Fibonacci extension level at 1.696. Beyond that sits the 2020 low at 1.44. On the other hand, in the event of a turn higher, that would expose the February high at 3.027 towards the long-term falling trendline from last year.
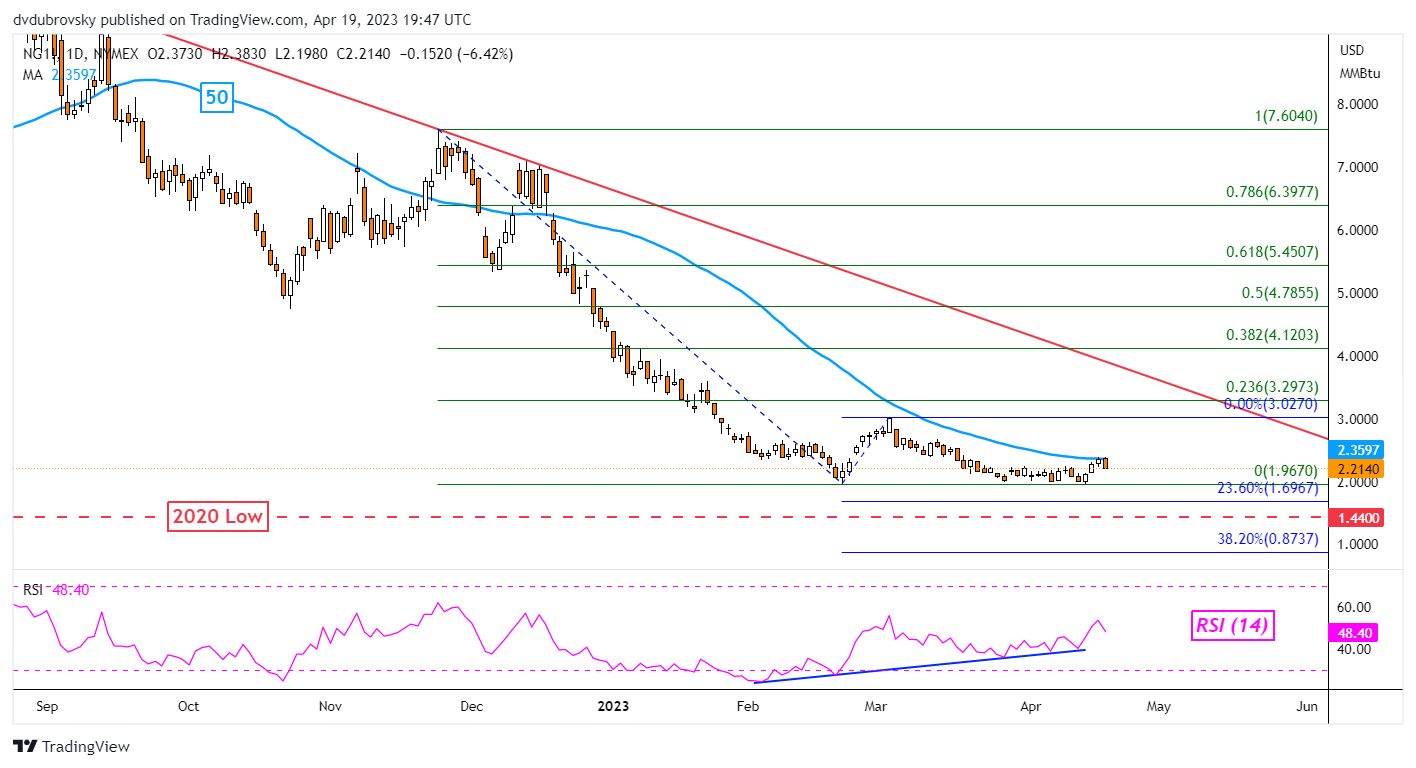
Chart Created Using TradingView
4-Hour Chart – Rising Wedge Breakout
Looking at the 4-hour setting can help paint a better picture of what has been going on in natural gas and what could happen next. Prices initially broke above a Rectangle chart pattern after the ceiling was pierced at 2.238. But, the 61.8% Fibonacci retracement level at 2.373 held as resistance. During this near-term rise, a Rising Wedge was forming.
Since then, prices confirmed a downside breakout, opening the door to extending lower. Now, a confirmatory break under the former ceiling of the rectangle exposes the floor at 1.998. But, it should be noted that prices are above the 100-period SMA. This line could hold as support, pivoting prices back to the ceiling of the rectangle.
Resuming higher entails facing the midpoint of the Fibonacci retracement level at 2.498.

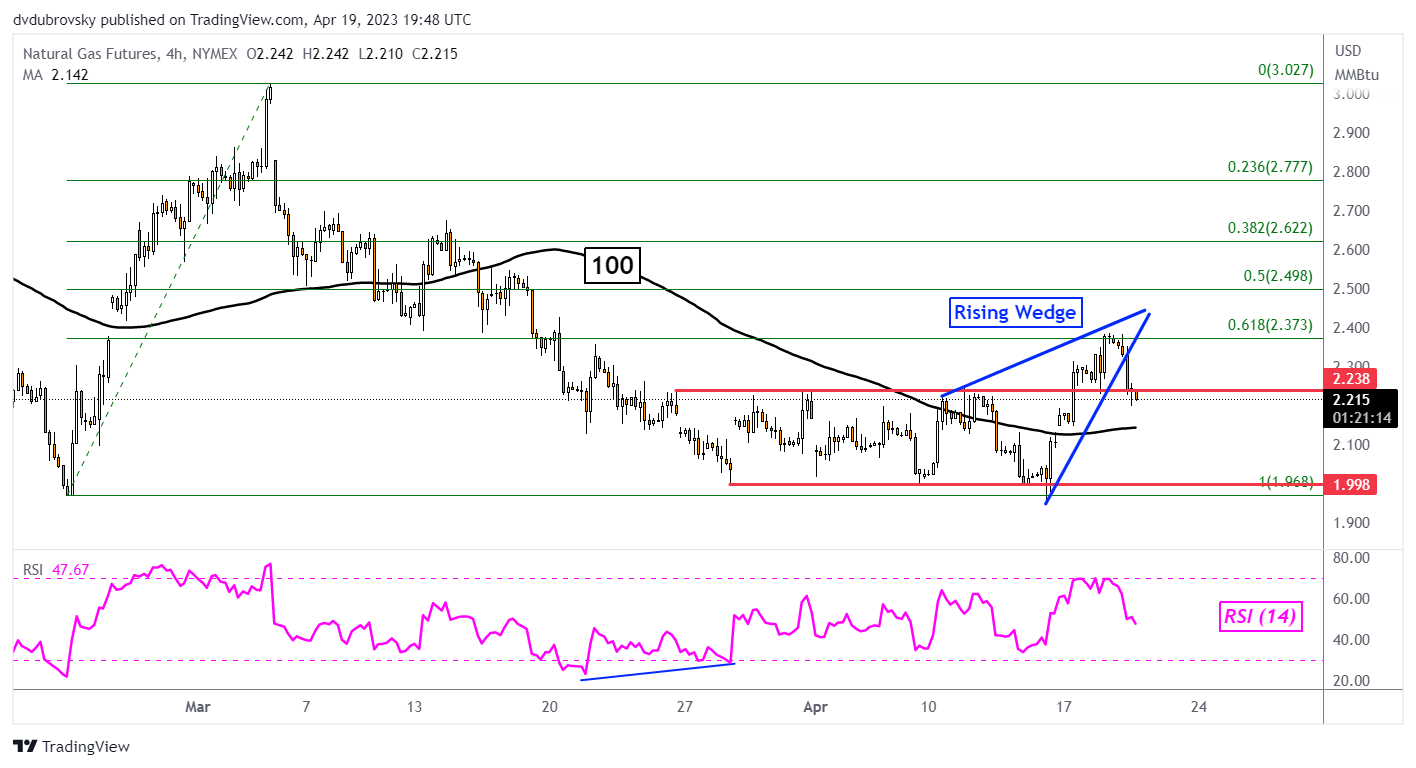
Chart Created Using TradingView
--- Written by Daniel Dubrovsky, Senior Strategist for DailyFX.com
To contact Daniel, follow him on Twitter:@ddubrovskyFX