
Natural Gas, 2-Day Rally, Eyes on Key Moving Averages – Technical Update:
- Natural gas prices rallied the most in 2 days since November
- The downside technical bias holds, eyes on moving averages
- On 4-hour setting, the former bearish rectangle is back in play
Trade Smarter - Sign up for the DailyFX Newsletter
Receive timely and compelling market commentary from the DailyFX team
Daily Chart – Best 2-Day Rally Since November
Over the past 2 days, natural gas prices rallied over 11.5 percent, marking the best 48-hour period since early November. This followed the presence of positive RSI divergence, showing that downside momentum was fading. Is the heating commodity reading for a reversal? Or will the broader downtrend prevail?
On the daily chart below, natural gas finds itself revisiting the 100% Fibonacci extension level at 2.326. This was after prices established a new low at 1.967 before turning higher. Broadly speaking, a bearish Head & Shoulders chart formation remains in play, offering a downward technical bias towards the 2020 low at 1.44.
Immediate resistance is at 2.326. Breaking higher exposes the 20-day Simple Moving Average (SMA). The latter is helping maintain the downward focus and could play out as key resistance. Extending higher exposes the May 2021 low at 2.832.
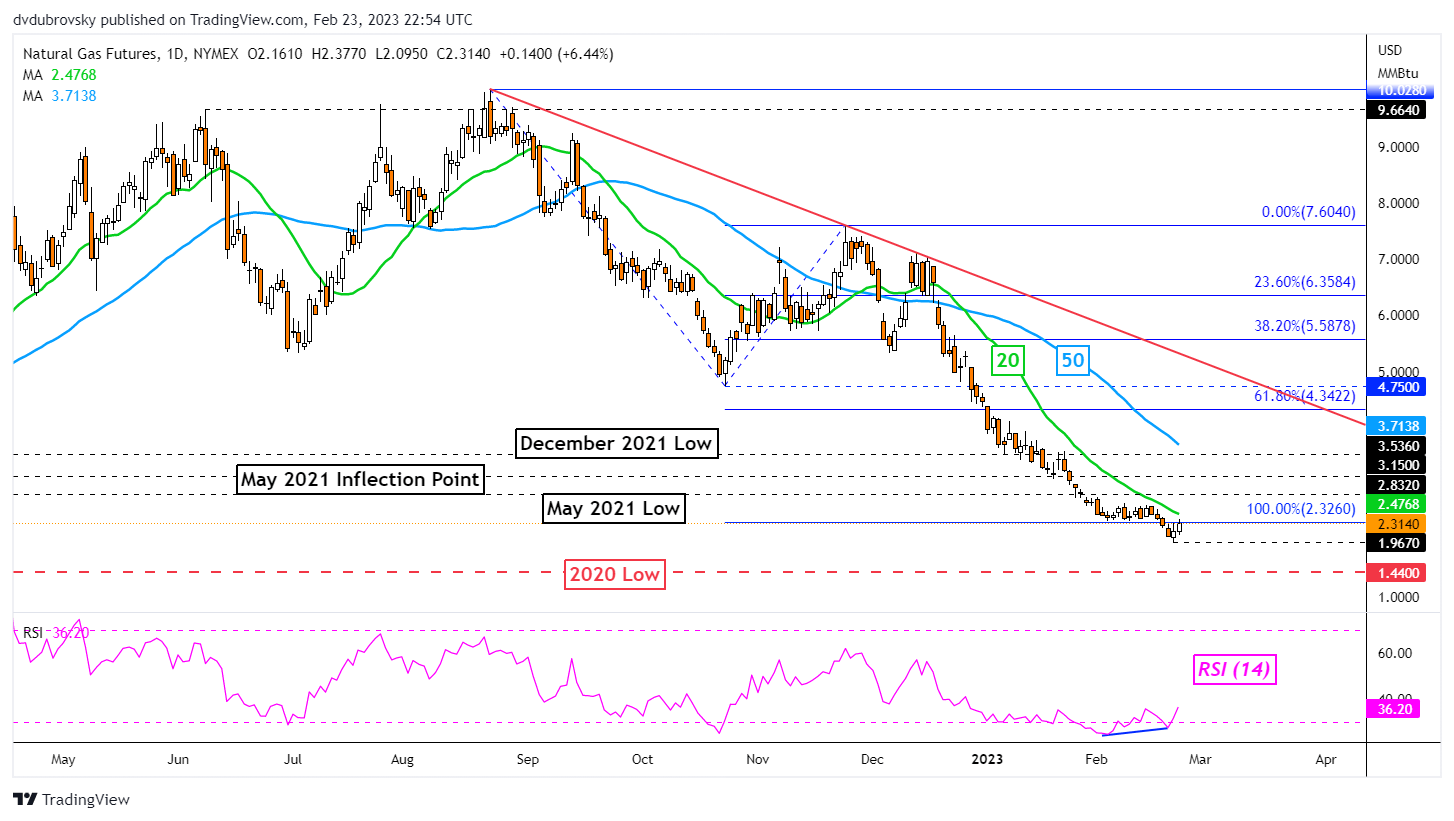
Chart Created Using TradingView
4-Hour Chart – Back in the Rectangle
Zooming in on the 4-hour chart will give us a better idea of how the near-term bounce is shaping up. Natural gas closed back into the former bearish Rectangle from early February. The floor was at 2.341. Still, confirmation is lacking at the time of publishing. Meanwhile, prices are about to face the 100-period SMA, which could maintain the downside bias.
A turn lower back under 2.341 places the focus on the current February low at 1.968. Otherwise, clearing the SMA places the focus on the ceiling of the rectangle around 2.657. Confirming a push above the latter could offer an increasingly bullish perspective.

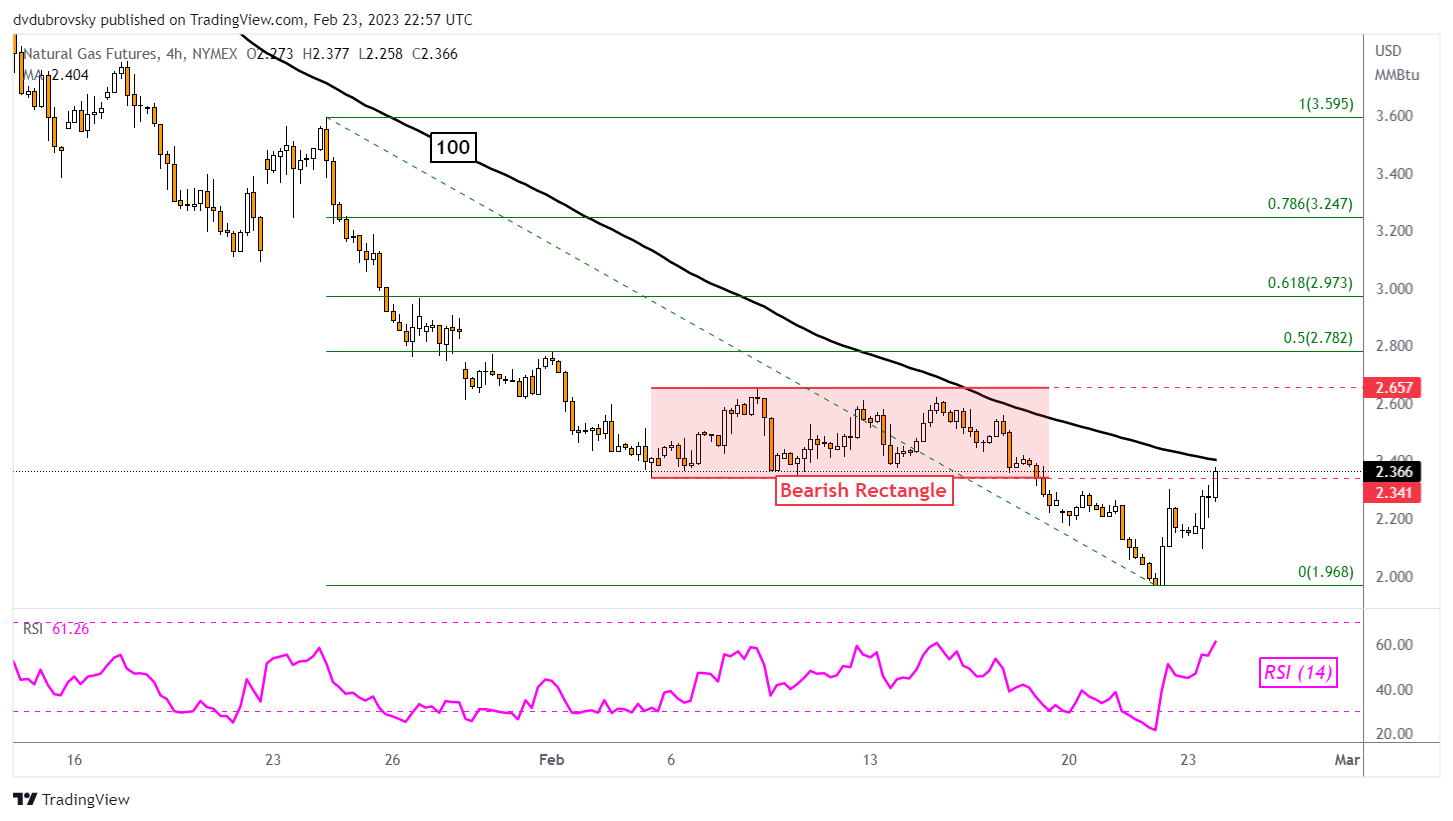
Chart Created Using TradingView
--- Written by Daniel Dubrovsky, Senior Strategist for DailyFX.com
To contact Daniel, follow him on Twitter:@ddubrovskyFX