

FTSE 100 continues to range trade with a bullish bias
The FTSE 100 continues to sideways trade above the 55-day simple moving average (SMA) at 8,213 but below Tuesday’s high at 8,314. A rise above this level would put the early June high at 8,364 on the map. A fall through Friday’s low at 8,187 could provoke a sell-off to the 8,138 last May low, though.
FTSE 100 Chart
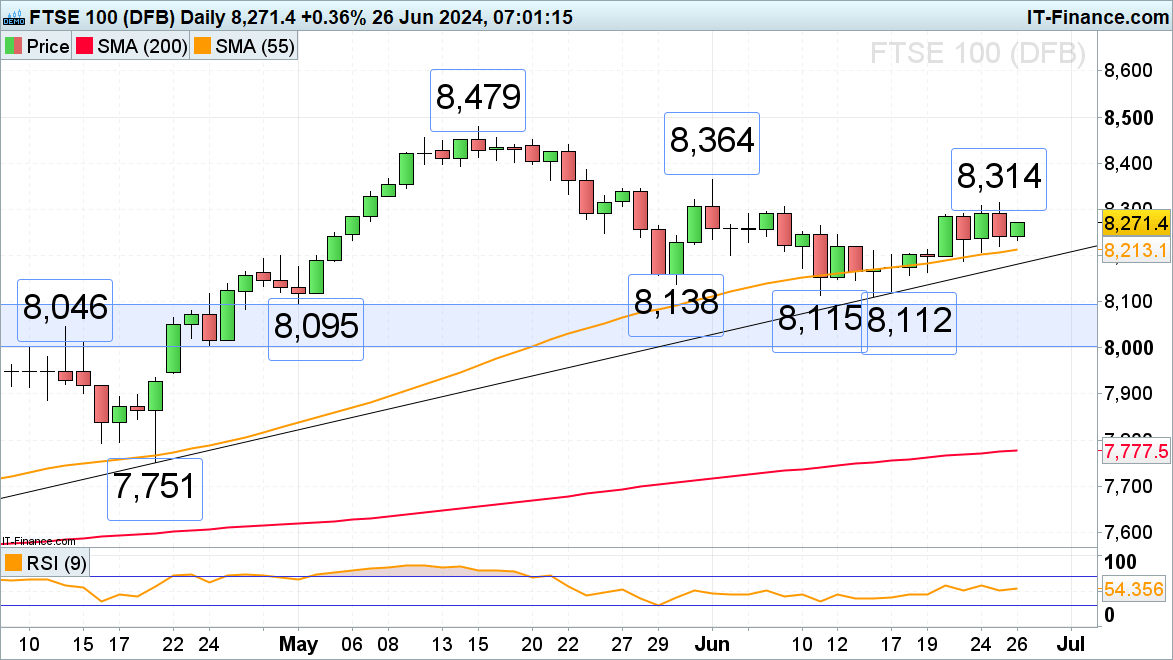
Source: ProRealTime, IG
| Change in | Longs | Shorts | OI |
| Daily | -2% | -3% | -3% |
| Weekly | 30% | -12% | 3% |
DAX 40 trades back above 50% retracement
The DAX 40 trades back above the 50% retracement of the April-to-May advance at 18,170 and tries to reach the 55-day simple moving average (SMA) at 18,331 as well as Monday’s high at 18,357 and the 18,361 early June low.
Minor support below the 50% retracement at 18,170 can be found at Tuesday’s 18,071 low.
DAX Daily Chart
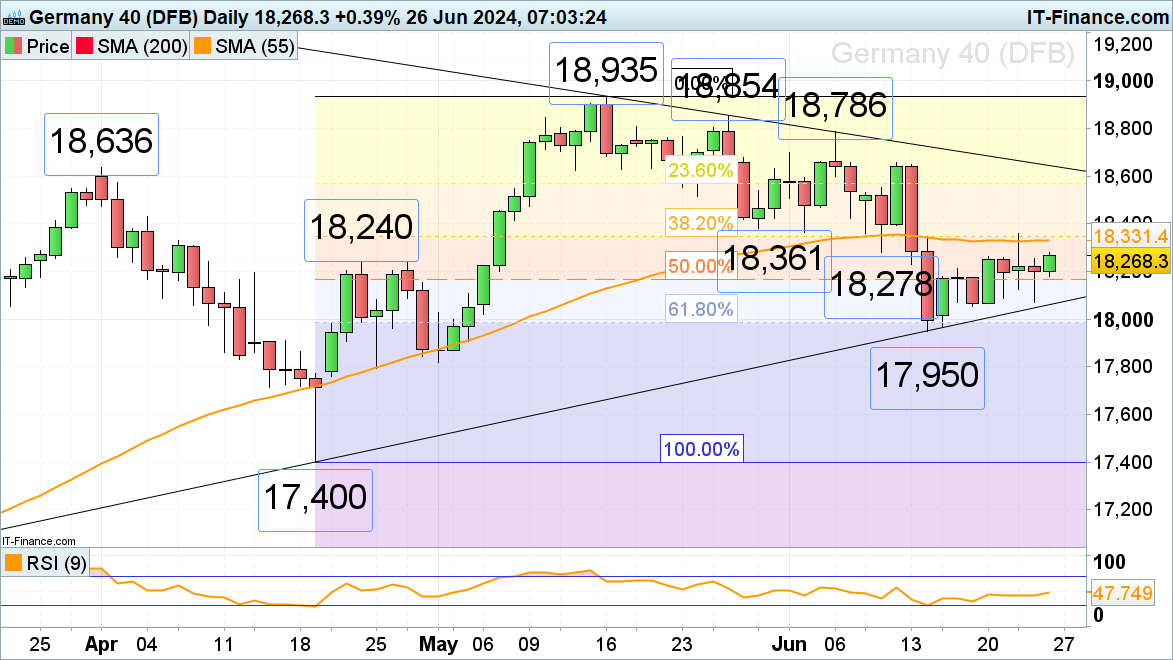
Source: ProRealTime, IG
S&P 500 resumed its ascent
The S&P 500 has regained recently lost ground and attacks its Monday peak at 5,491, above which lurks its all-time high at 5,517. This short-term bullish view will be maintained while Monday’s low at 5,444 underpins. Currently unexpected failure there could lead to the mid-June low at 5,393 being revisited.
S&P 500 Daily Chart
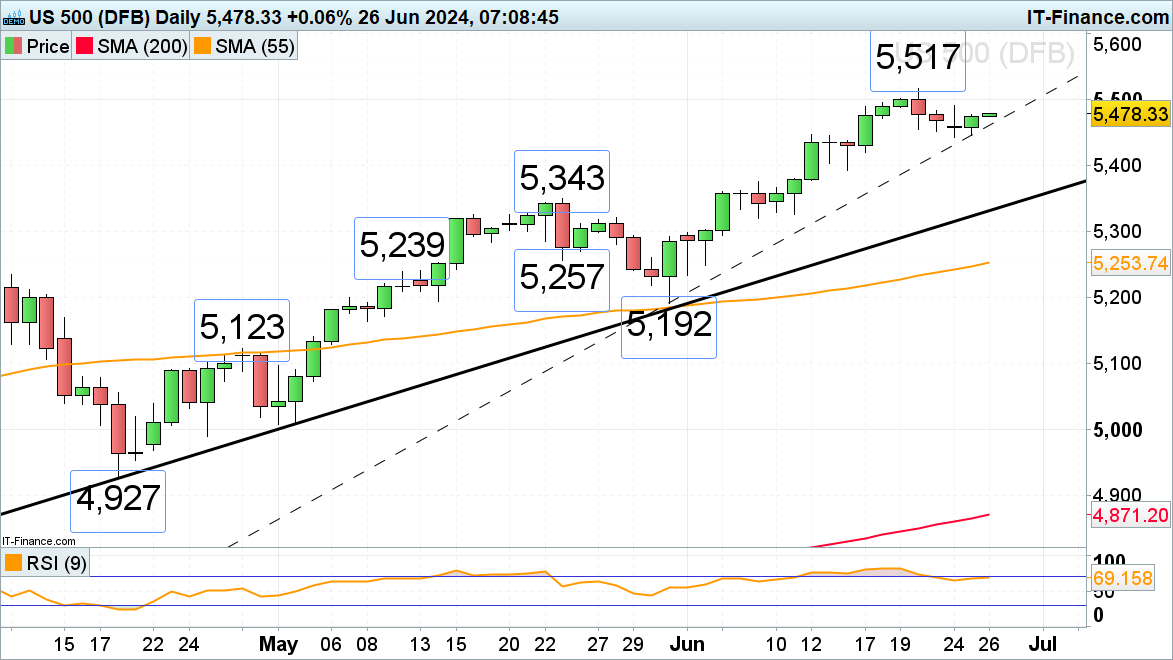
Source: ProRealTime, IG
If you're puzzled by trading losses, why not take a step in the right direction? Download our guide, "Traits of Successful Traders," and gain valuable insights to steer clear of common pitfalls