FTSE 100, DAX 40, S&P 500 Analysis and Charts
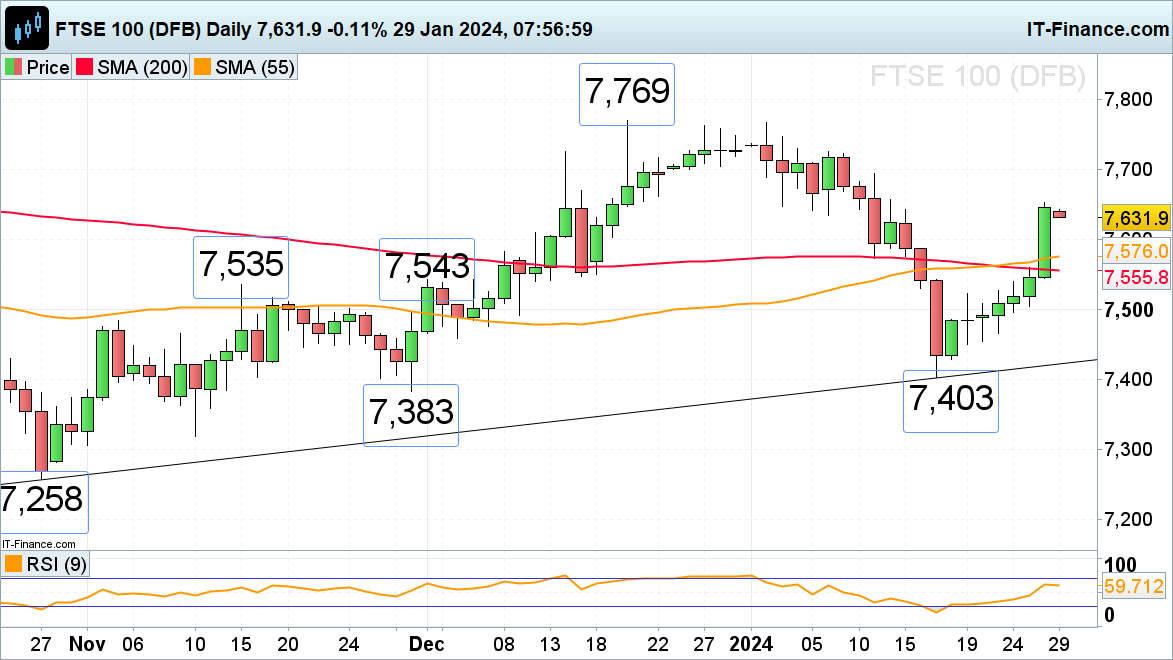
FTSE 100 mixed after healthy gains last week
The FTSE 100’s gradual advance from its mid-January low at 7,403 accelerated to the upside on Friday amid rallying luxury good stocks and general risk-on sentiment with the index gaining 1.4%. Monday morning is likely to be quieter, though, as the economic calendar looks pretty empty ahead of this week’s US Federal Reserve (Fed) and Bank of England (BoE) monetary policy meetings, earnings by five of the ‘magnificent seven’ US stocks and US employment data.
A rise above Friday’s 7,653 high would engage the 11 January high at 7,694. Minor support comes in around the 12 December 7,609 high and at the 16 January 7,587 high.
FTSE 100 Daily Chart
Retail trader data shows 45.35% of traders are net-long with the ratio of traders short to long at 1.20 to 1. The number of traders net-long is 0.72% higher than yesterday and 41.07% lower from last week, while the number of traders net-short is 0.67% higher than yesterday and 99.34% higher from last week.
See What this Data Means and How It Influences Price Action
| Change in | Longs | Shorts | OI |
| Daily | -33% | 19% | -8% |
| Weekly | -19% | 16% | -1% |
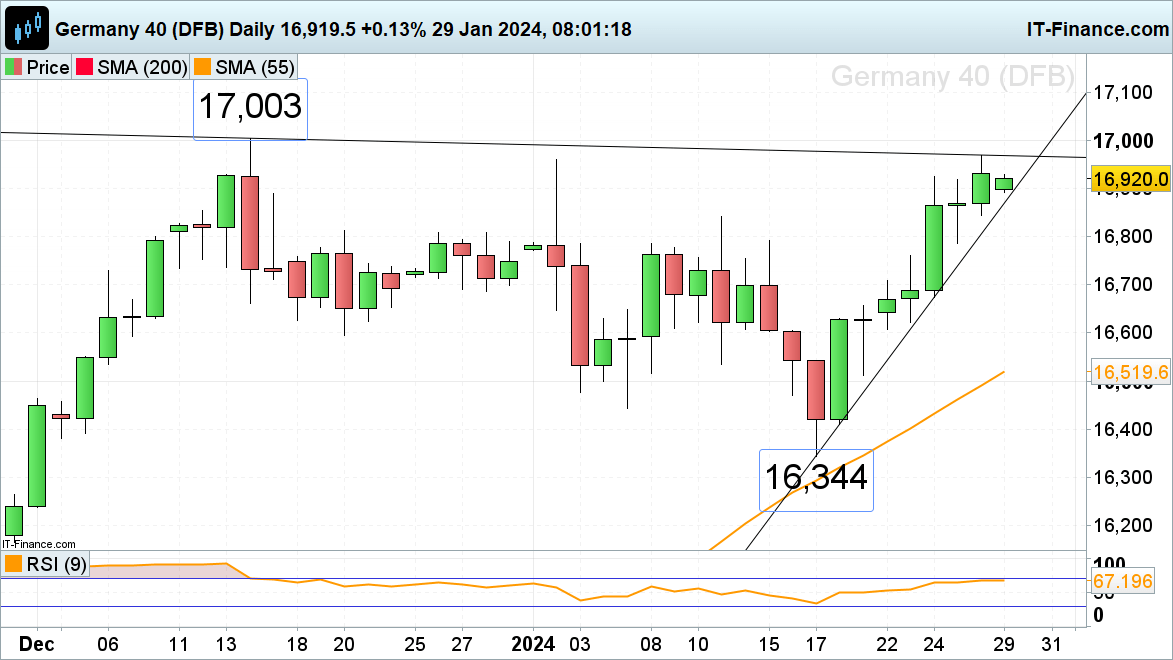
DAX 40 mixed after five consecutive days of gains
The DAX 40 index continues its advance toward its December record high around the 17,000 mark as investors look forward to a packed macro and earnings week.
The January uptrend line at 16,872 may act as support, together with the 11 January high at 16,841 whereas the December-to-January resistance line at 16,966 and last week’s high at 16,969 should act as resistance ahead of the December 17,003 peak.
DAX 40 Daily Chart
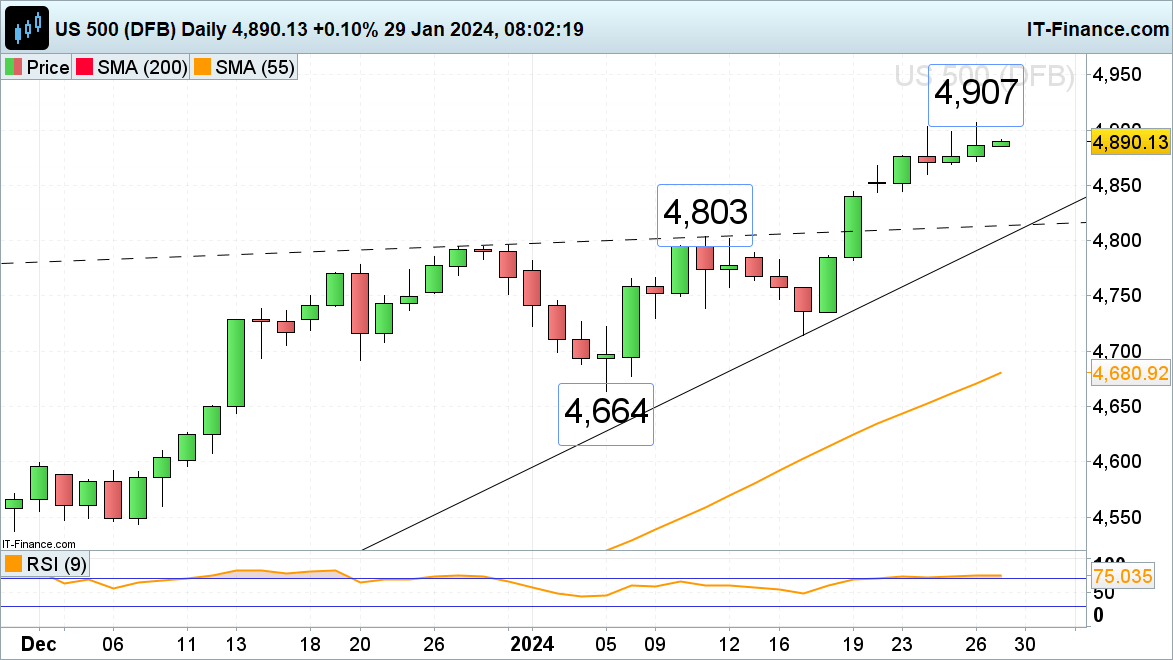
S&P 500 consolidates below last week’s record highs
The S&P 500 is seen trading close to last week’s record highs made marginally above the 4,900 mark as investors await earnings by the likes of Alphabet, Amazon, Apple, Meta, and Microsoft which are likely to provide additional volatility.
A rise above last week’s 4,907 record high may engage the psychological 5,000 mark. Minor support below the Tuesday 23 high at 4,877 comes in at Friday’s 4,871 low.
S&P 500 Daily Chart