

S&P 500, DJIA, DOW JONES INDUSTRIAL AVERAGE - TECHNICAL OUTLOOK:
- The S&P 500 index’s rally appears to be losing steam, but there is no sign of reversal yet.
- The Dow Jones Industrial Average has recouped nearly all of its August-September losses.
- What are the signposts to watch for a change in the medium-term trend?

S&P 500 SHORT-TERM TECHNICAL OUTLOOK - NEUTRAL
A negative divergence (rising index associated with easing momentum) on the daily charts suggests that the S&P 500 index’s five-week rally is losing steam as it approaches fairly strong resistance on the 200-day moving average, slightly above the 89-day moving average. The index needs to break above the converged resistance for the medium-term weakness to fade.
S&P 500 INDEX Daily Chart
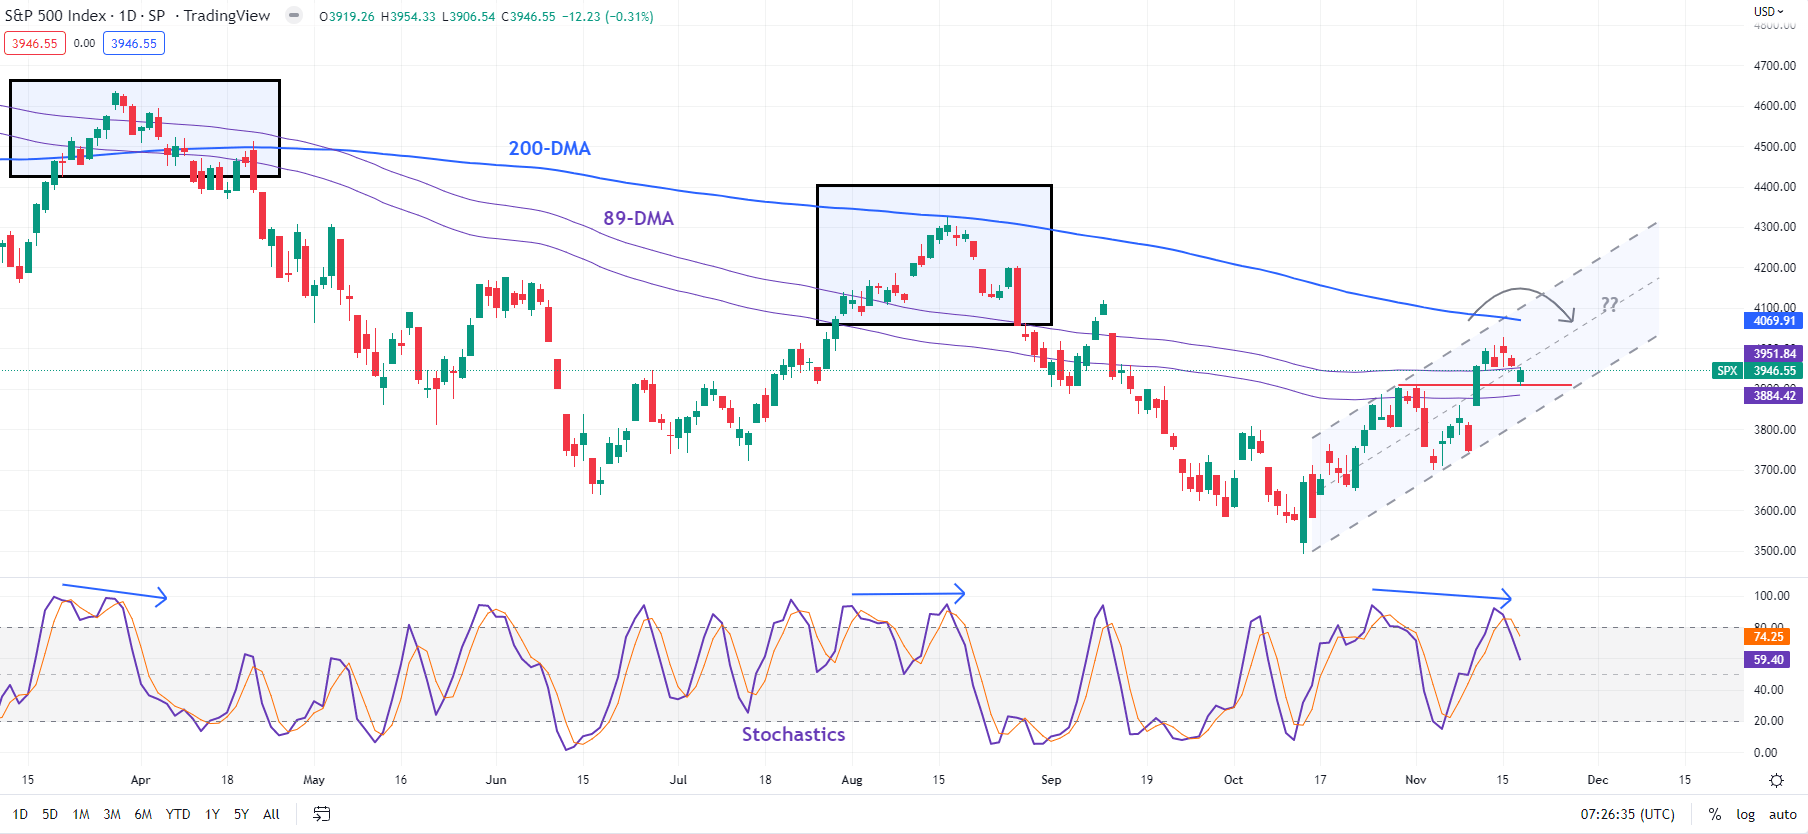
Chart Created Using TradingView
To be sure, the combined barrier along with negative divergence in the recent past have been followed by a retreat in the index (see chart). While there is no sign of reversal of the minor uptrend, any break below immediate support at the early-November high of 3912 would be an early sign that short-term upward pressure may be fading. A fall under the lower edge of a rising channel from October (now at about 3815) would confirm that the rebound is cracking.
DOW JONES INDUSTRIAL AVERAGE SHORT-TERM TECHNICAL OUTLOOK – NEUTRAL
The Dow Jones Industrial Average (DJIA) appears to be the stronger of the two indices going by the extent of the recent rebound. The index has recouped nearly all of its August-September losses, thanks to one of the strongest rebounds since October. However, short-term momentum appears to be easing as it approaches a tough hurdle, including the August high of 34280 and roughly coinciding with the upper edge of a bearish channel from early 2022. This raises the prospect of a minor retreat.
DJIA Weekly Chart
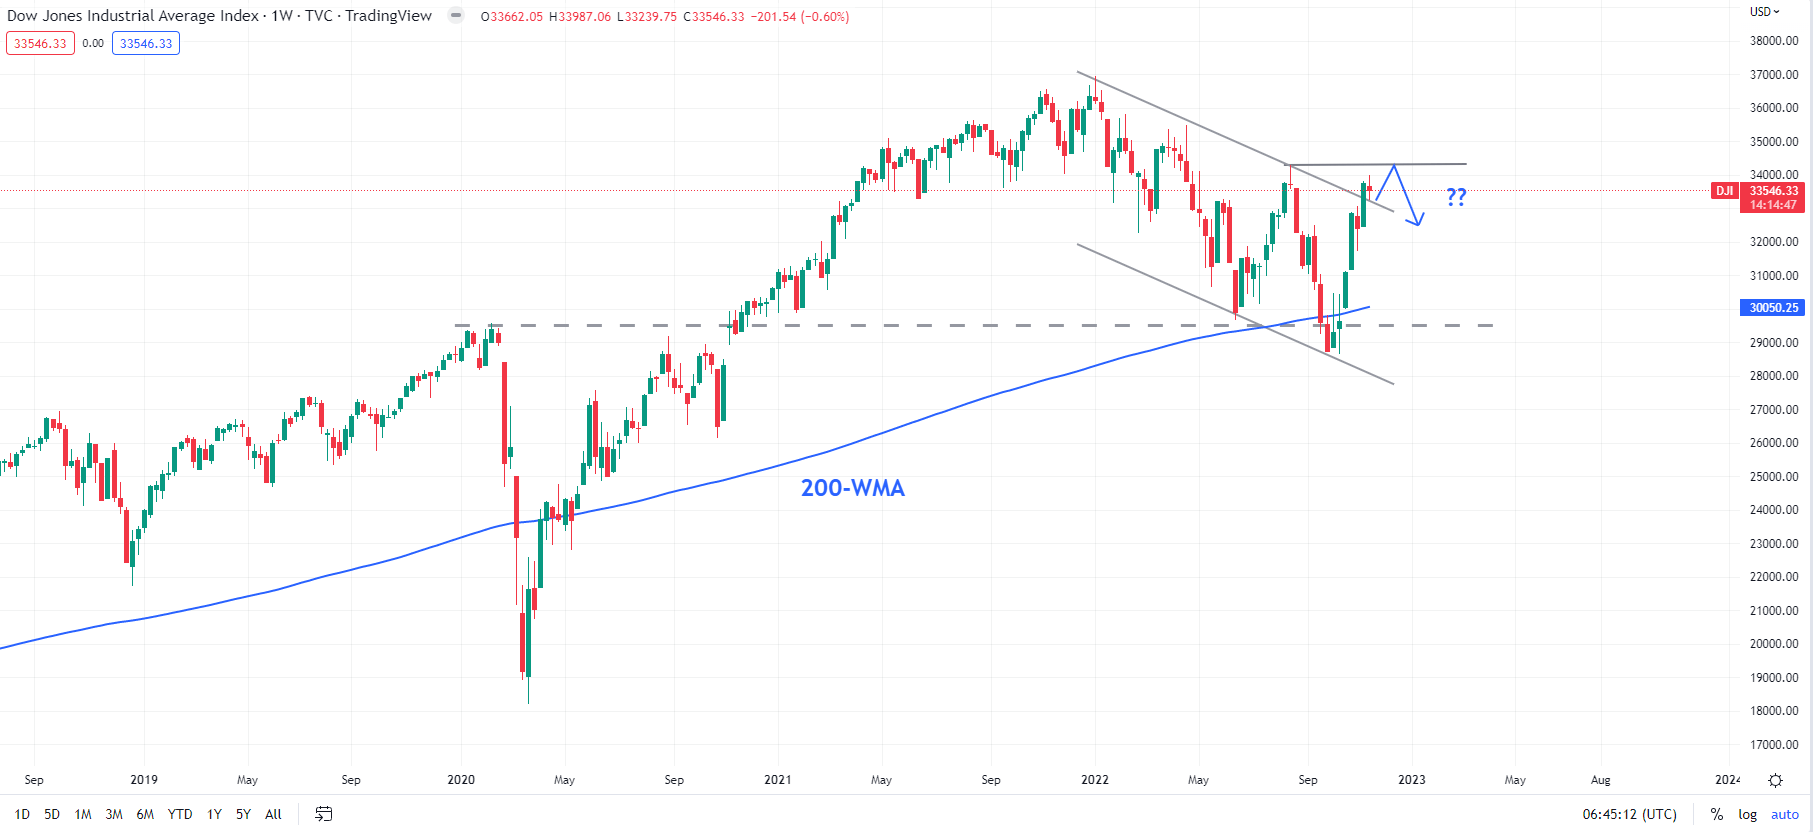
Chart Created Using TradingView
Looking beyond the short term, the near-100% retracement of the August-September fall coupled with the rebound in early October from strong support on the 200-week moving average and the pre-Covid high suggests that the medium-term outlook could be shifting to “neutral”. In this regard, a break above 34280 is required.

--- Written by Manish Jaradi, Strategist for DailyFX.com