

S&P 500, SPX, NASDAQ 100, NDX - OUTLOOK:
- Tuesday’s drop below key support has somewhat dented the bullish outlook in US equities.
- However, the uptrend hasn’t reversed on the daily timeframe yet.
- What is the outlook for the S&P 500 and the Nasdaq 100 index?

Tuesday’s drop below key support has somewhat dented the bullish outlook in US equities. However, the uptrend hasn’t reversed on the daily timeframe yet.
Stronger-than-expected US data since the start of this month has led to a reassessment that the Fed may not be as dovish as some of the pricing seemed to suggest until the beginning of February. The dramatic repricing higher in Fed rate expectations coupled with hawkish comments by Federal Reserve officials in recent days have reinforced the ‘higher (rates) for longer’ theme.
The key focus is now on the minutes of the last Fed meeting due later today, which could give some clues on the committee’s impression of how high rates could go, especially after Fed Chair Powell didn’t lean to an aggressive stance earlier this month. Moreover, as the US earnings season draws to a close, the market’s focus appears to be getting back to rates and the US growth outlook. Leading indicators point to a mild recession, but a higher rates outlook could rekindle hard-landing concerns.
S&P 500 Daily Chart
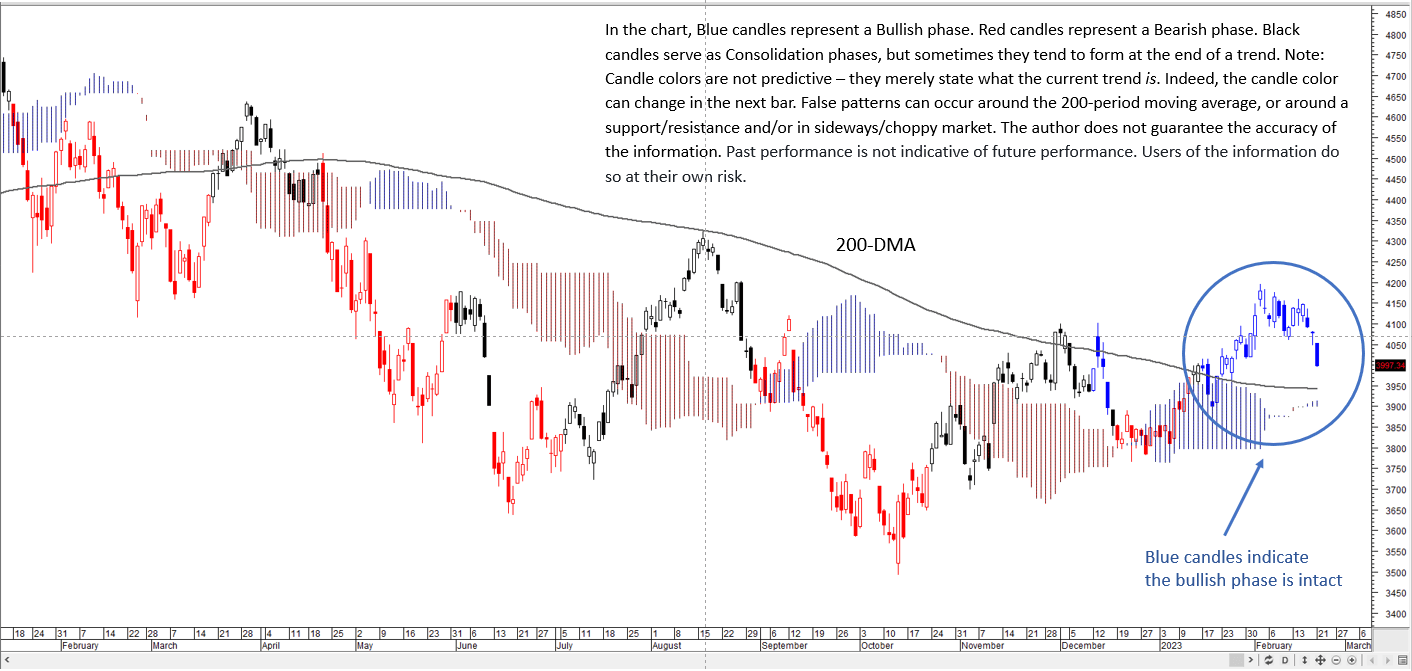
Chart Created by Manish Jaradi Using Metastock
On technical charts, the S&P 500 index’s drop below a horizontal trendline from the end of 2022 (at about 4100) confirms that the upward pressure has eased somewhat. However, the color-coded candlestick charts, based on trending/momentum indicators, show the bullish phase is intact despite the slide on Tuesday.
S&P 500 Daily Chart
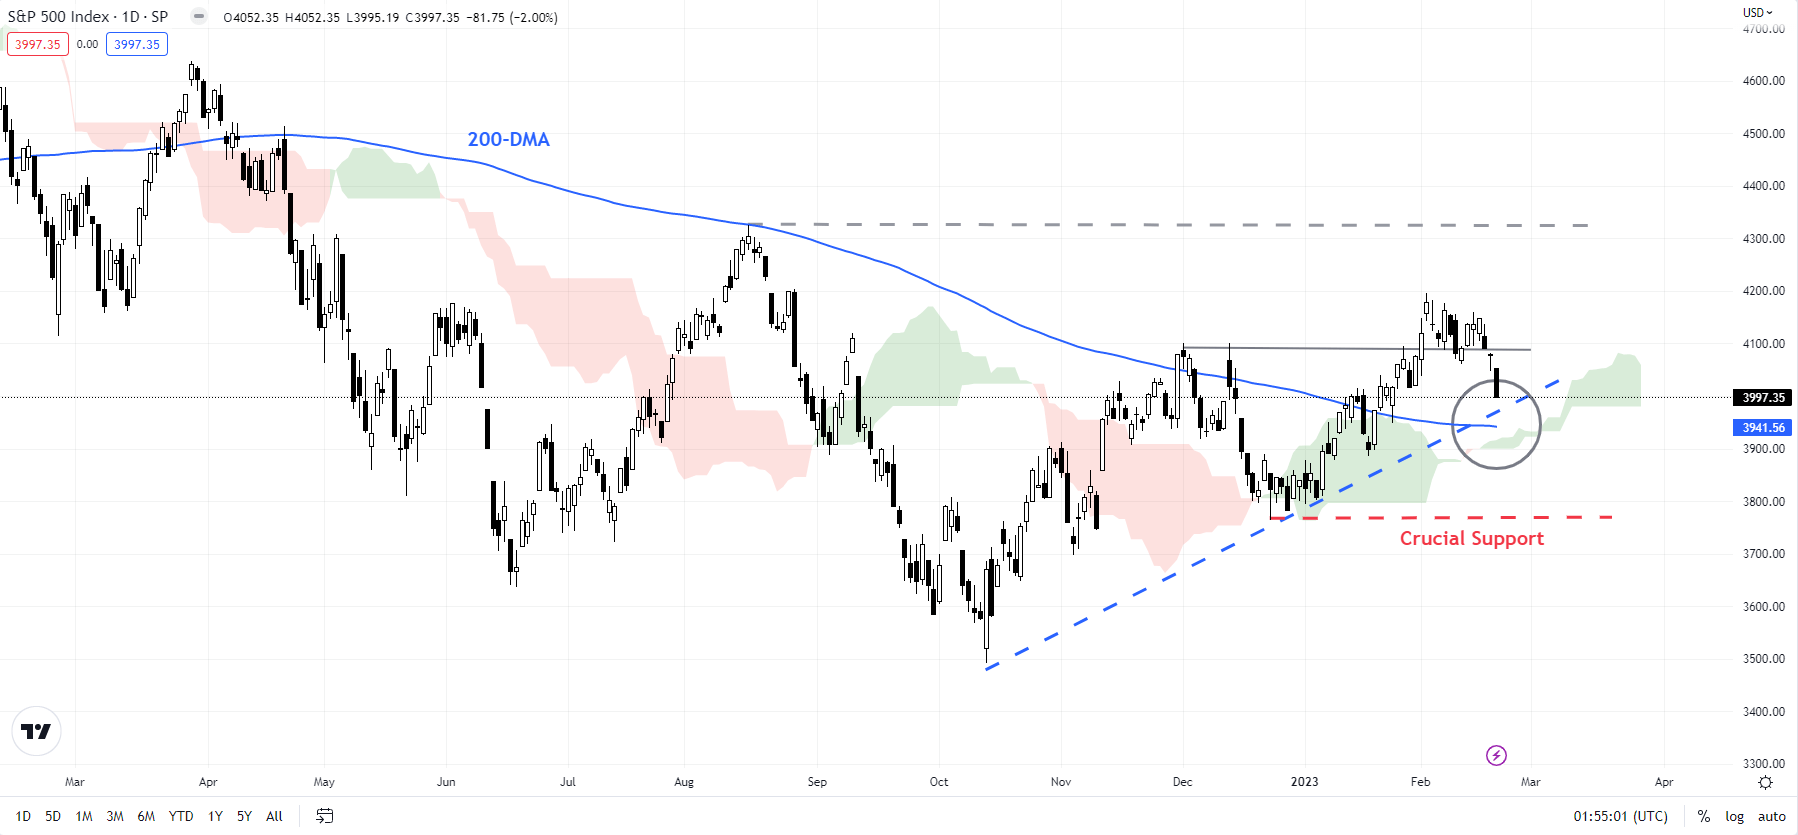
Chart Created Using TradingView
Market breadth continues to be healthy with 65% of the members in the S&P 500 index above their respective 100-day moving average (DMA) and 60% of the members above their respective 200-DMA. Nearly 60% of the members have the Moving Average Convergence Divergence indicator in positive territory on the daily charts – reflecting an uptrend.
NASDAQ 100 Daily Chart
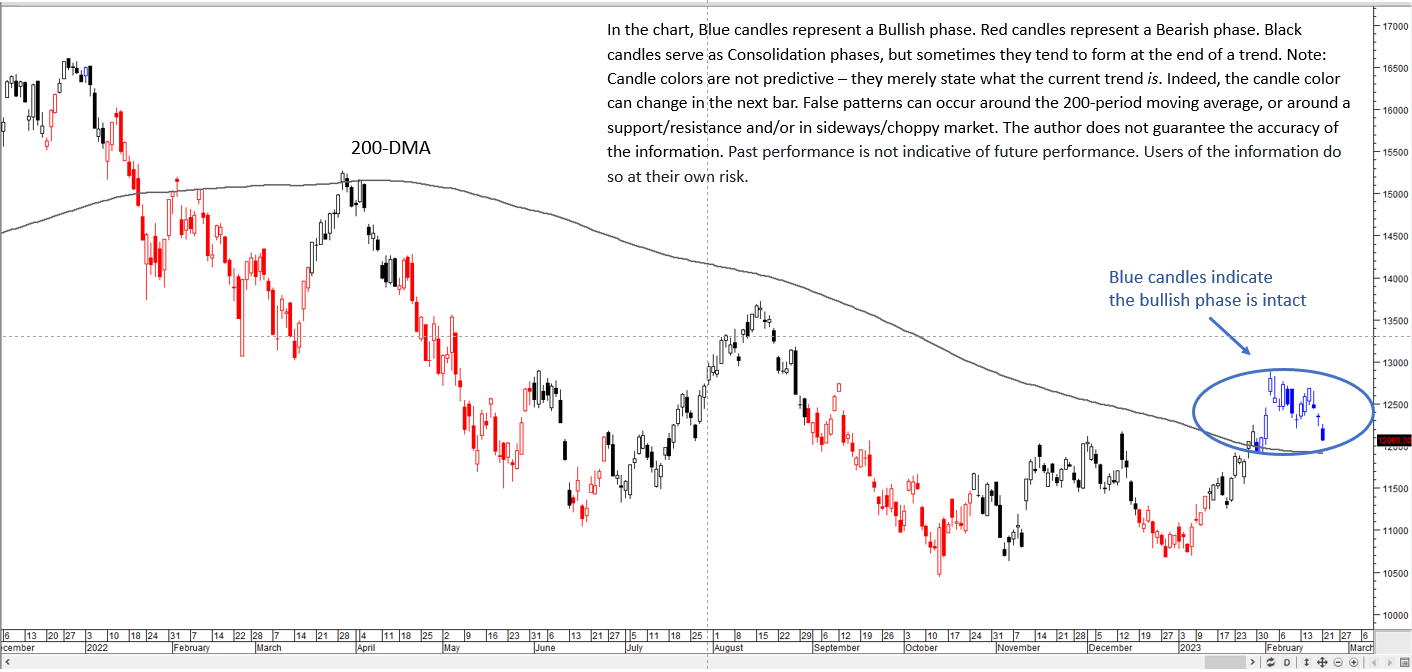
Chart Created by Manish Jaradi Using Metastock
The S&P 500 index is now approaching a fairly strong support area: the 200-DMA, the lower edge of the Ichimoku cloud support on the daily chart – the retreat in December stalled at the cloud support. A crucial cushion is at the December low of 3765 – a break below would confirm that that the four-month-long upward pressure had faded as it would disrupt the higher-top-higher-bottom pattern since October, pointing to a broader 3500-4200 range in the interim.
NASDAQ 100 Weekly Chart
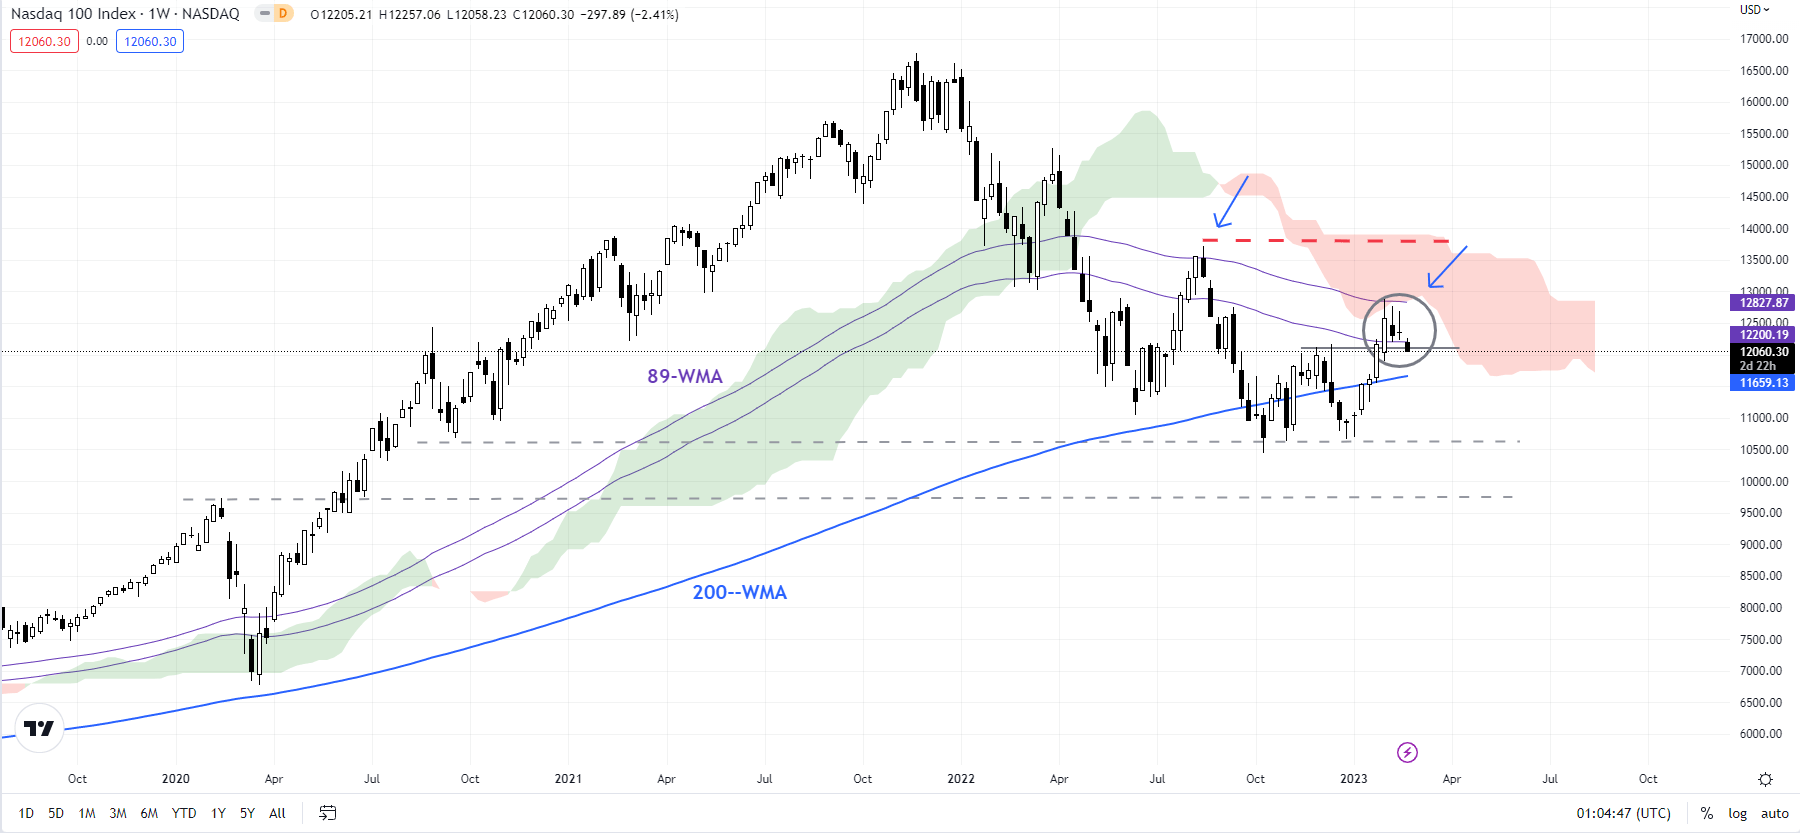
Chart Created Using TradingView
Similarly, the Nasdaq 100 index continues to be in a bullish phase, as the color-coded candlestick chart shows. Still, the index’s fall below last week’s low has taken the sting out of the rally. The index is now testing a vital floor area of 11600-11900, including the 200-DMA and the 200-week moving average. Subsequent support is on the lower edge of the Ichimoku cloud on the daily chart.
Trade Smarter - Sign up for the DailyFX Newsletter
Receive timely and compelling market commentary from the DailyFX team
--- Written by Manish Jaradi, Strategist for DailyFX.com