

Indices Price Action Setups:
- US equities remain in a vulnerable state as earnings season gets underway.
- While it’s been overwhelmingly bearish price action so far this year, more recently, there’s been a slowing of bearish activity at support or after establishment of fresh lows. This makes for a challenging environment for retail traders as breakout strategies can get stifled and counter-trend strategies begin to look more attractive.
- We’re starting to see the impact of higher rates in corporate earnings and the big question mark for this quarter is guidance and how companies anticipate impact for future earnings.
- The analysis contained in article relies on price action and chart formations. To learn more about price action or chart patterns, check out our DailyFX Education section.

The S&P 500 set a fresh yearly low last week, albeit temporarily. It was a quick move ahead of the US market open on Thursday, just after the CPI report showed Core CPI at a fresh high, and sellers had about an hour of run before the NYSE opened for the day. And right at 9:30, equities began to pivot and within a few hours the Nasdaq was already more than 7% above its early-morning low. The S&P 500 bounce came in at a more reasonable 6.62% from trough-to-peak, illustrating just how exuberant that Thursday session really was.
Sellers came back on Friday, however, and erased a large portion of that move. Which brings up an interesting observation: Fridays have been especially brutal for the equity trade of late. And if we think of the percolating risk across markets and what’s been showing in bonds and FX and hasn’t really shown in the stock market to the same degree (panic), that makes sense, with investors looking to close positions ahead of a weekend where there’s 48 hours of vulnerability to news headlines.
On the below chart, I’ve circled out the past nine Fridays and with the exception of Friday, September the 9th, there’s been a bearish overall feel.
S&P 500 Four-Hour Chart
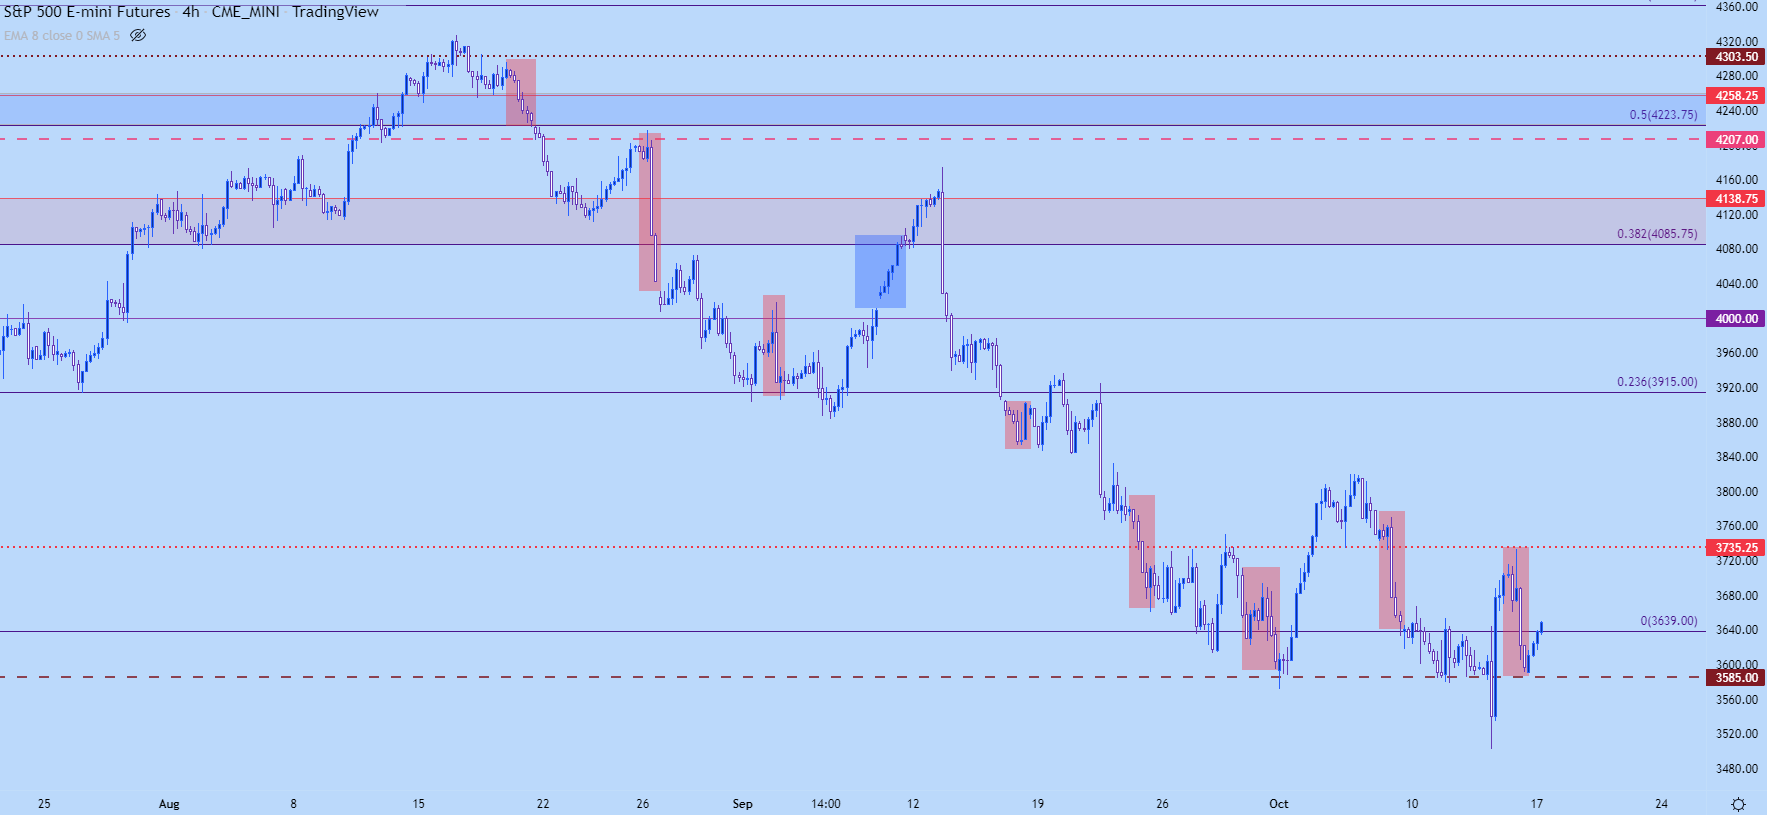
Chart prepared by James Stanley; S&P 500 on Tradingview
What Does This Mean?
I’ve discussed this previously but in my opinion equity markets are between a rock and a hard place. While short-term sentiment gets incredibly bearish which can be evidenced by considerable put buying, I also don’t think we’ve seen capitulation from long-term investors to much of a degree. And the reason for that is a dearth of opportunity costs. Normally in a falling market such as we’ve had this year, there will also be falling yields as markets anticipate a softer touch from the Central Bank.
But, when the Central Bank and their harsher touch is what’s creating the sell-off, bonds aren’t exactly all that attractive – especially when the Central Bank is telling you that they’re going to a) continue to hike rates and b) going to continue to sell bonds via QT, which becomes another factor that’s pushing yields higher (more supply). So the safer harbor of bonds doesn’t look all that safe anymore.
This also means that while the backdrop looks decidedly bearish, as we’ve seen since June and were reminded of again last week, the trend will likely not be a one-sided move. And it’s during bear markets that we can see some of the strongest rips, such as what showed up last Thursday.
For those that are bearish or that want to be bearish – waiting for resistance can help to avoid getting caught selling lows, which has been a difficult prospect of late in the S&P 500.
Case-in-point, on the below chart, I’ve marked the June low at 3639 with a red horizontal line. I’ve also added a red box for all price action that was below that level last week and notice where sellers weren’t able to get much run below that level – which was the same price that was in-play four months ago.
S&P 500 Daily Price Chart
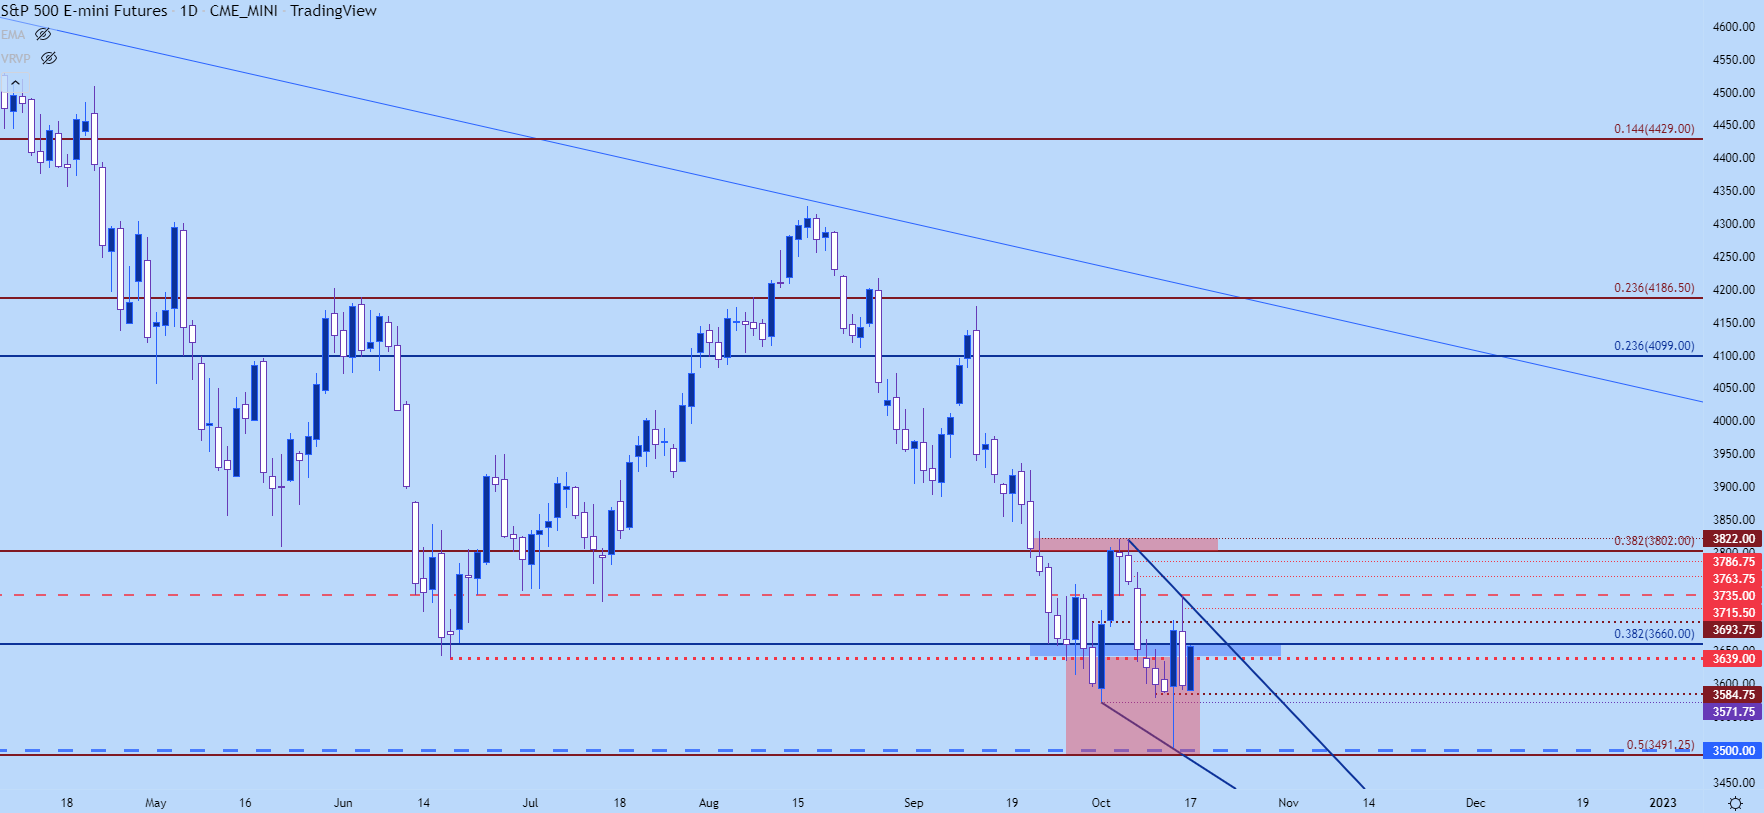
Chart prepared by James Stanley; S&P 500 on Tradingview
On the above chart, there’s also a possible falling wedge that’s currently forming. But, notably, it’s the 3660 Fibonacci level that’s been a restraint to bearish trends of late and that’s a price level that’s back in-play ahead at this week’s open.
Above the 3660 level, 3735 looms large as this was the swing-high last week was already a resistance-turned-support level. Above that, we have a bullish break of the falling wedge, and the door opens to larger pullback potential in the pair, with 3802-3822 acting as a major resistance level sitting overhead.
On the support side of the matter, I’m tracking key support at 3571-3584 which has only been traded through for a short period of time. If sellers can breach that, the focus goes to 3500 which was my first support target for the Q4 Top Trade in the S&P 500.

S&P 500 Four-Hour Chart
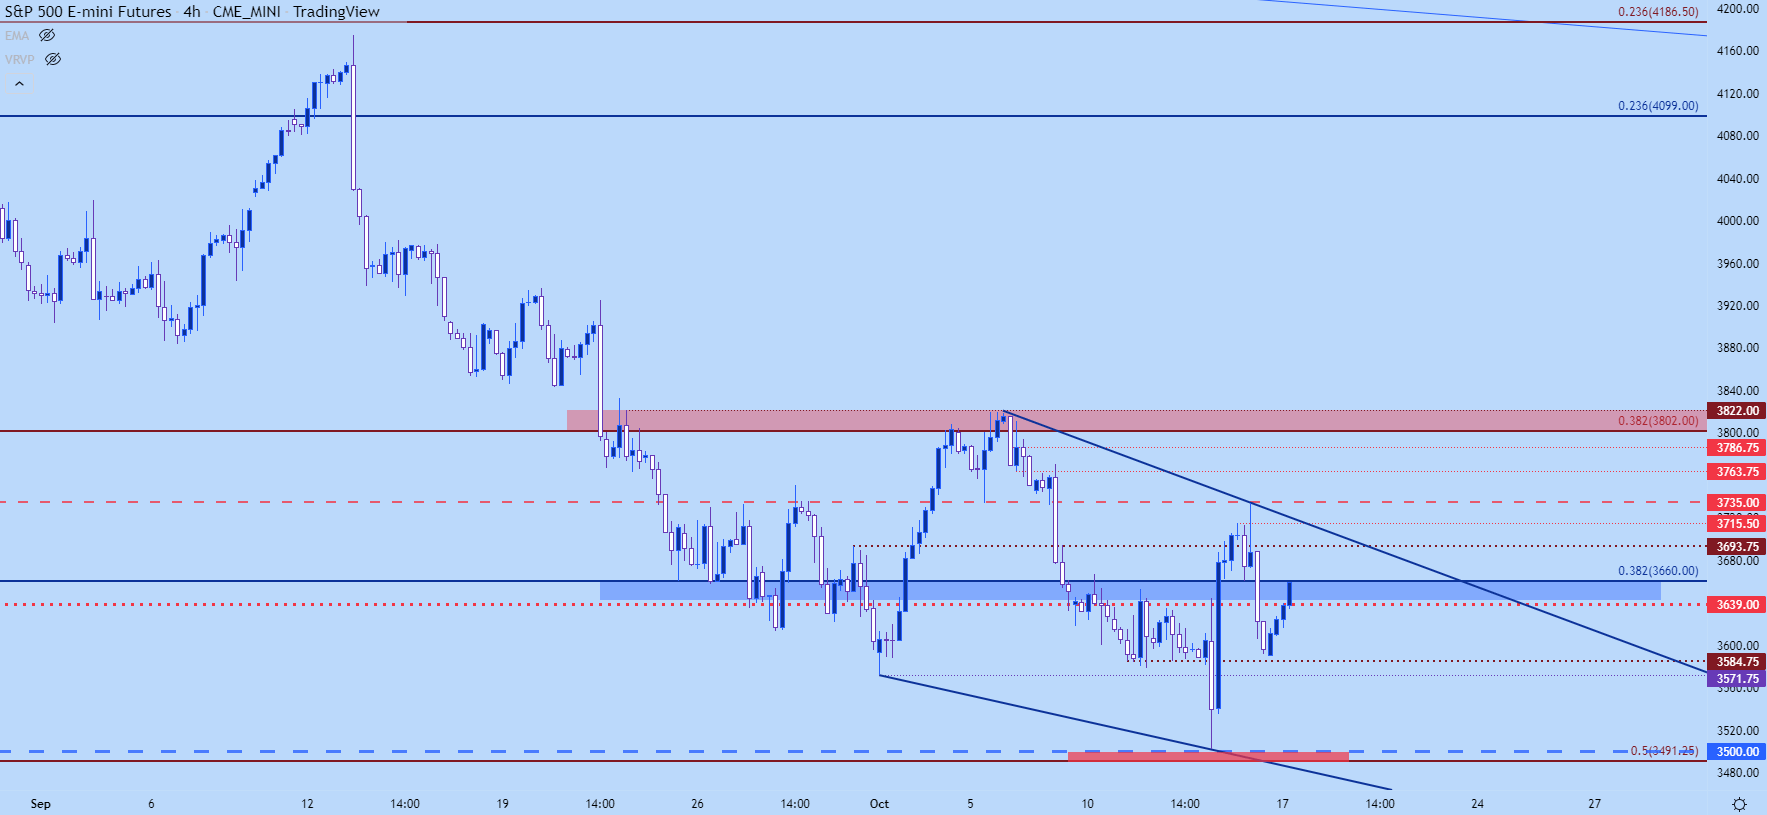
Chart prepared by James Stanley; S&P 500 on Tradingview
Nasdaq Bounces from Key Support
While the S&P 500 was a couple of ticks off of my first support target in the Top Trade installment, the Nasdaq 100 did hit that level last week.
That price was at 10,501 and it’s the 61.8% Fibonacci retracement of the pandemic move. That level came into play on Thursday morning, just after CPI, and it led to a massive bounce that ran as high as 7.33%. Price found resistance in a familiar area, spanning from 11,091-11,294, with the help of a bearish trendline, and then gave back a large portion of those gains on Friday.
For resistance, I’m tracking spots at 11,091 and then the zone from 11,229-11,294. If bulls can force a break-above that, we have a breach of the bearish trendline and the door opens to a deeper pullback move. For deeper pullbacks, I’m tracking resistance potential at 11,367, 11,550 and then 11,698.
Nasdaq Four-Hour Chart
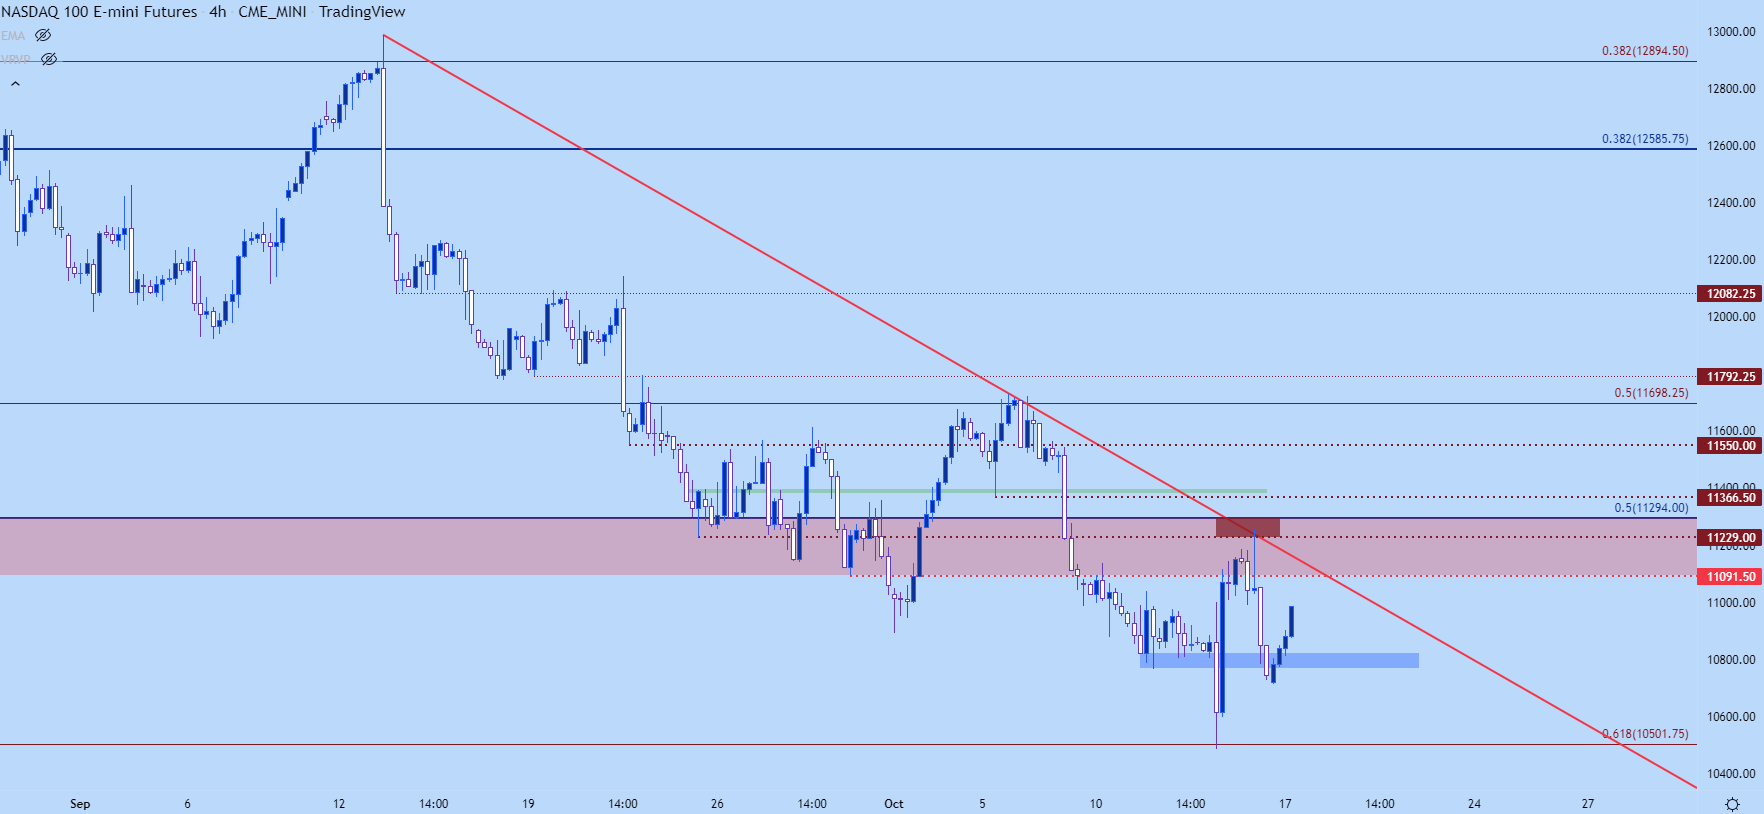
Chart prepared by James Stanley; Nasdaq 100 on Tradingview
The Dow
I had looked at the Dow just after the CPI alert on Thursday and as I shared there was a large resistance level sitting just overhead, around the 38.2% Fibonacci level of the pandemic move which plots at 29,671.
Last week’s bar closed right around that level and this week prices are catching a bounce. This highlights an area of short-term resistance that was in-play last week that runs from 30,422 up to 30569. A break above that opens the door for a push to support-turned-resistance at 31,167.
On the support side of the matter, that 29,671 level can be lined up with 29,815 to create a zone. If sellers can breach that, then the lows are vulnerable but there’s been some pretty considerable support already in that zone, from around 29,175 which I’m tracking as a mid-line between the two points of support.

Dow Jones Daily Chart
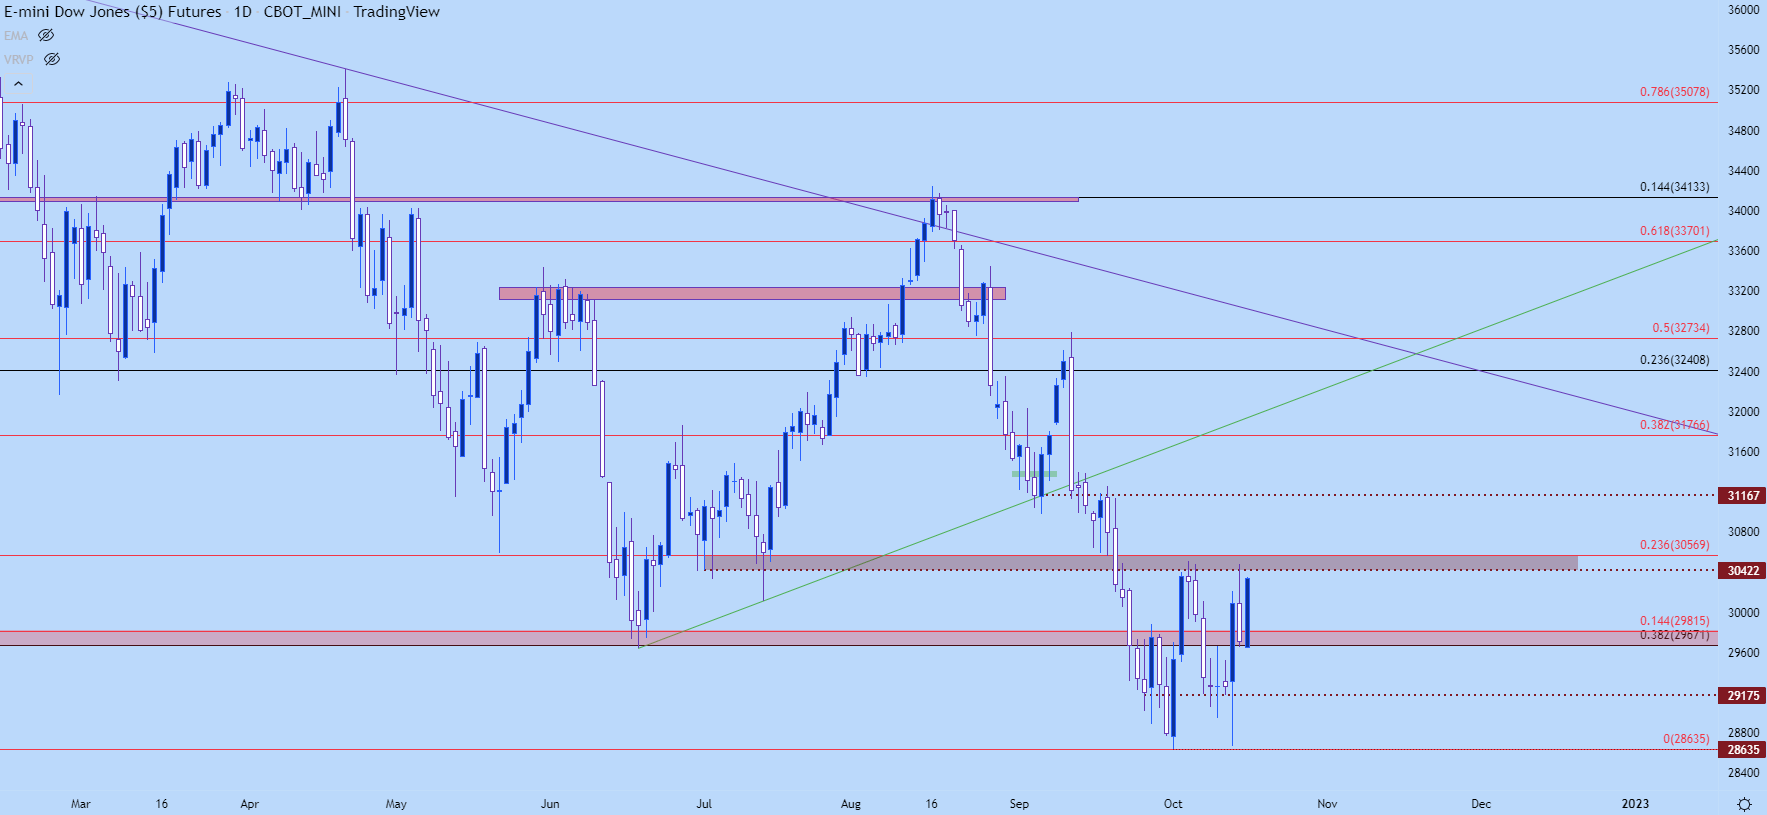
Chart prepared by James Stanley; Dow Jones on Tradingview
--- Written by James Stanley, Senior Strategist, DailyFX.com & Head of DailyFX Education
Contact and follow James on Twitter: @JStanleyFX