


S&P 500 - TECHNICAL OUTLOOK:
- The S&P 500 nascent uptrend appears to be running out of steam.
- So far, the evidence doesn’t suggest the uptrend has reversed.
- What is the outlook and what are the signposts to watch?

S&P 500 TECHNICAL OUTLOOK – NEUTRAL
The sharp fall on Wednesday suggests that cracks are beginning to appear in the S&P 500 index’s month-long rebound.
Yesterday’s slide has disrupted (but not broken) the higher-highs-higher-lows pattern since mid-October. That is, this week’s high of 3859 is a lower high relative to the early-November high of 3912. A higher-top-higher-bottom formation signifies an uptrend and a crack in the pattern can be a warning sign of a change in the trend. Any break below last week’s low of 3698 would confirm the break of the sequence, implying the minor trend had changed sideways from up.
S&P 500 Hourly Chart
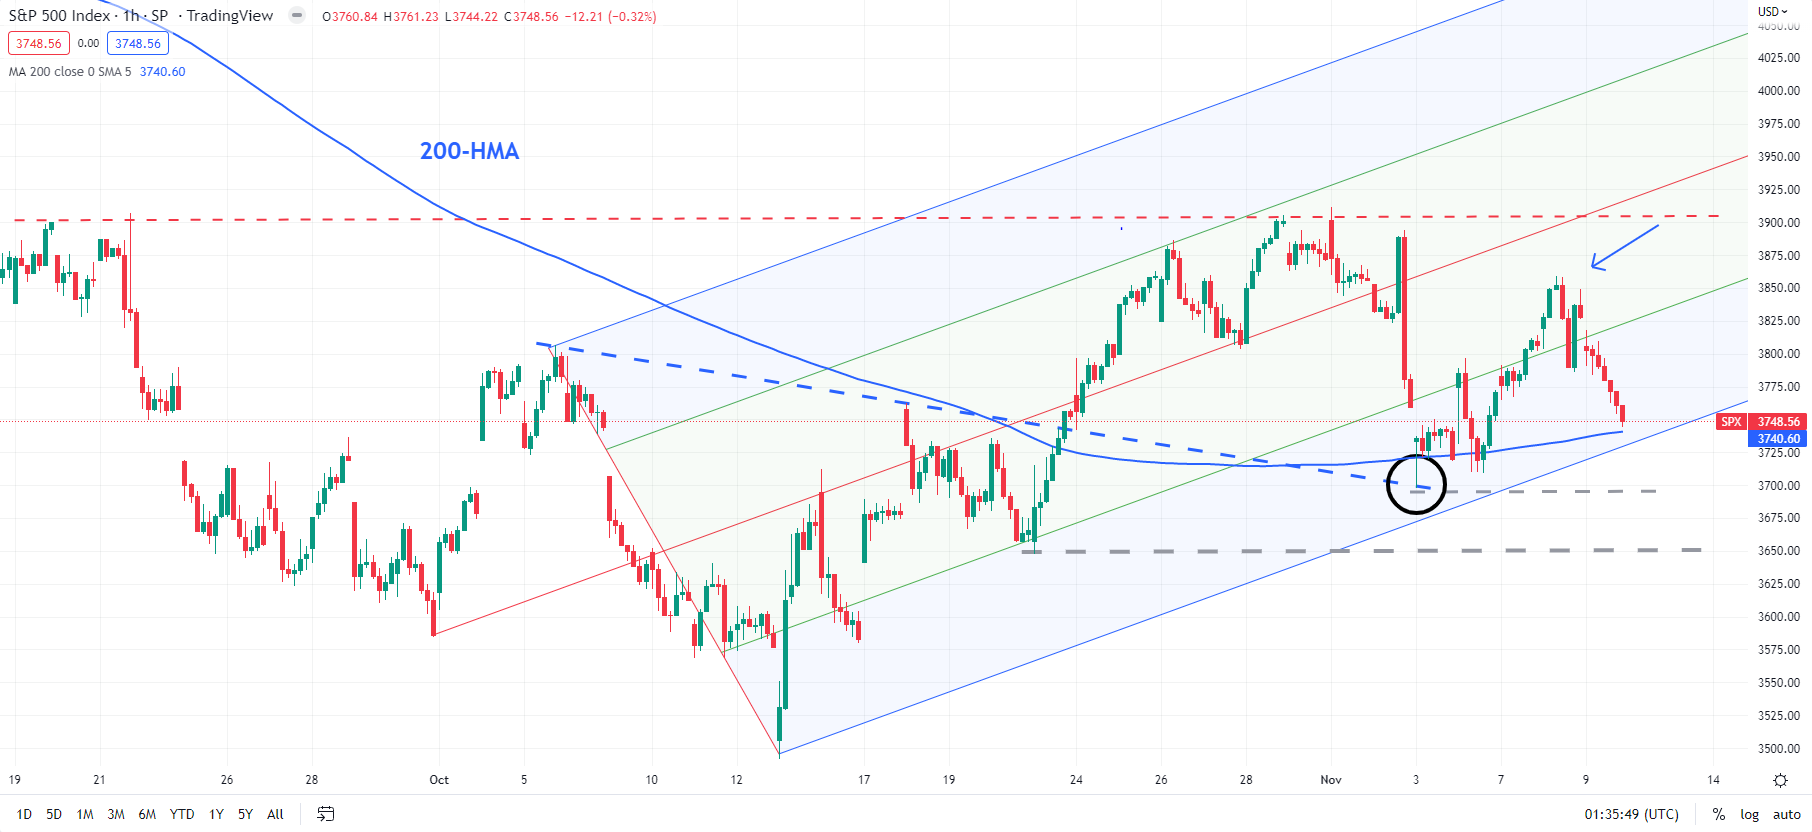
Chart Created Using TradingView
So far, the S&P 500 index has held key support levels identified in the previous update, while also being within a rising channel from the end of September. It is now testing key converged floor on the 200-hour moving average (now at about 3740), not too far from last week’s low of 3698. It is quite possible that the index could rebound from the cushion and resume the higher-highs-higher-lows formation, keeping the nascent uptrend intact. In addition to holding the support at 3698, the S&P 500 index needs to initially break this week’s ceiling of 3859 and eventually the early-November peak of 3912.
S&P 500 Monthly Chart
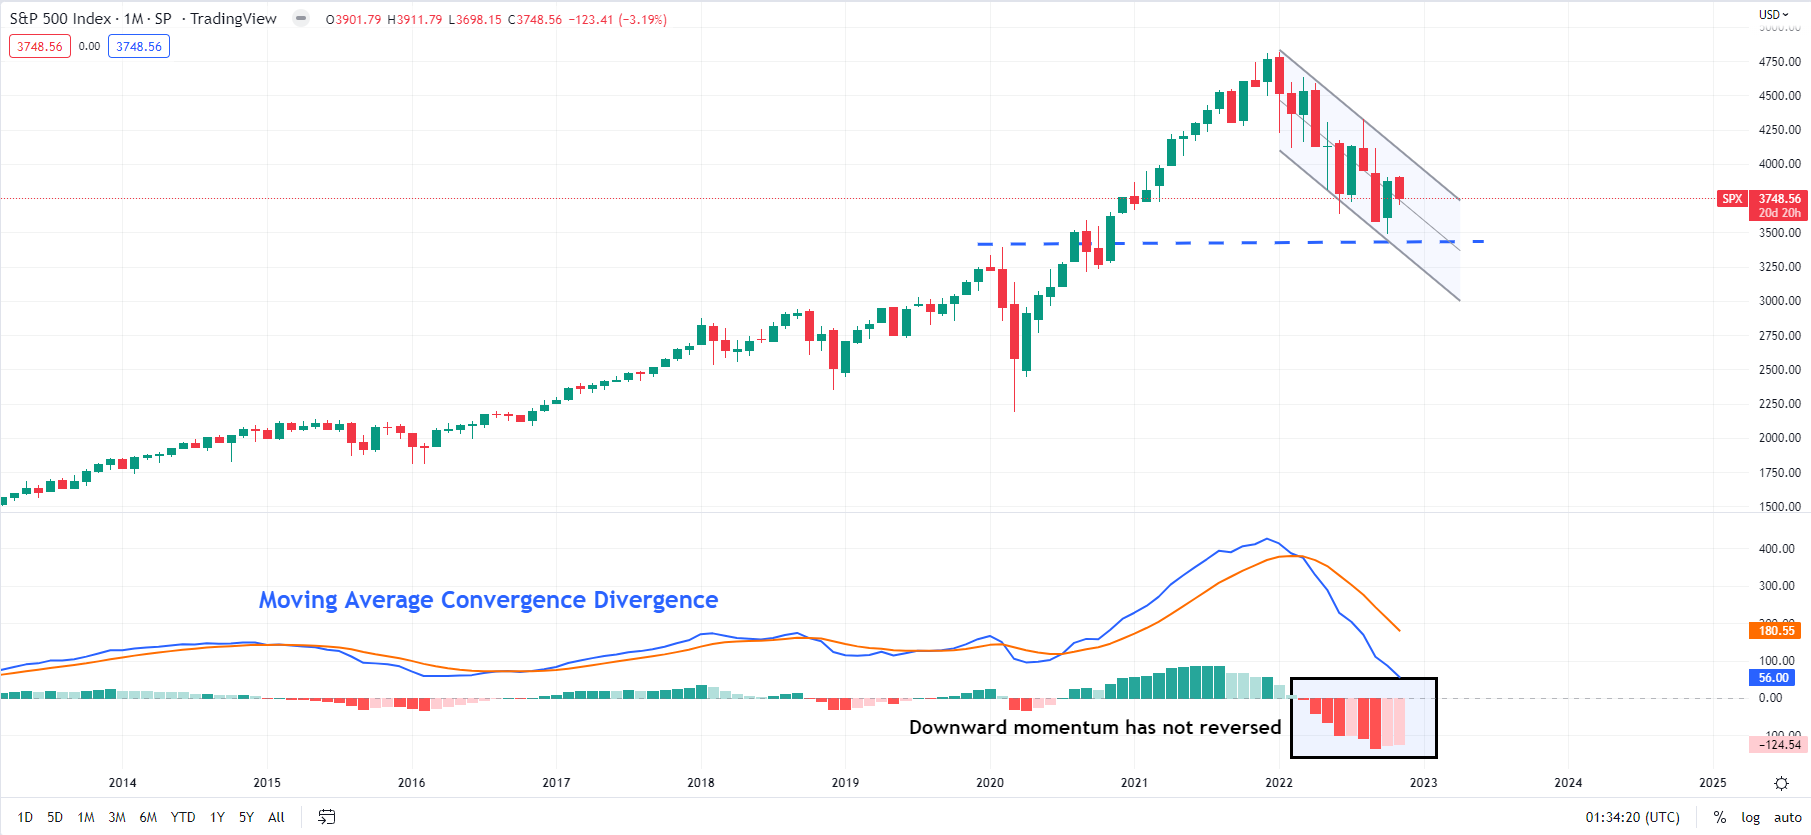
Chart Created Using TradingView
However, any break below last week’s cushion of 3698 could raise the odds of a retest of the October low of 3492. Furthermore, a decisive break below 3492, roughly around the 200-week moving average, would confirm that the medium-term weakness had resumed.
Looking beyond the short term, the index continues to hover in a downtrend channel from the start of 2022. Despite the recent rebound, the downward momentum hasn’t reversed, keeping the broader bias down for the index. Any break below the October floor of 3491 could push the index toward the pre-Covid top of 3394, and potentially deeper toward the September 2020 low of 3209.

--- Written by Manish Jaradi, Strategist for DailyFX.com


