
US Stock Indices Technical Forecast: Weekly Trade Levels
- SPX500 support 3664, 3419-3501 (key), 3142-3219- resistance 3906/07, 4007, 4105
- Nasdaq support 11119, 10589, 9206-9446 - resistance 11693/861, 12208, 12467/668
- Dow support at 28323, 26982-27583, 25371- resistance 32806, 33248, 33785-34006
The S&P 500, Nasdaq and the Dow Jones Industrial Average rallied for a second consecutive week with all three-indices continuing to build on the recent recovery off technical support. While the charts leave room for further near-term gains, the focus shifts to major event risk next week with the FOMC interest rate decision and US non-farm payrolls (NFP) likely to drive volatility into the November open. These are the targets and invalidation levels that matter on the S&P 500 (SPX500), Nasdaq (NDX) and the Dow Jones Industrial Average (US30) weekly technical charts. Review my latest Strategy Webinar for an in-depth breakdown of these technical stock setups and much more.
S&P 500 Price Chart – SPX500 Weekly
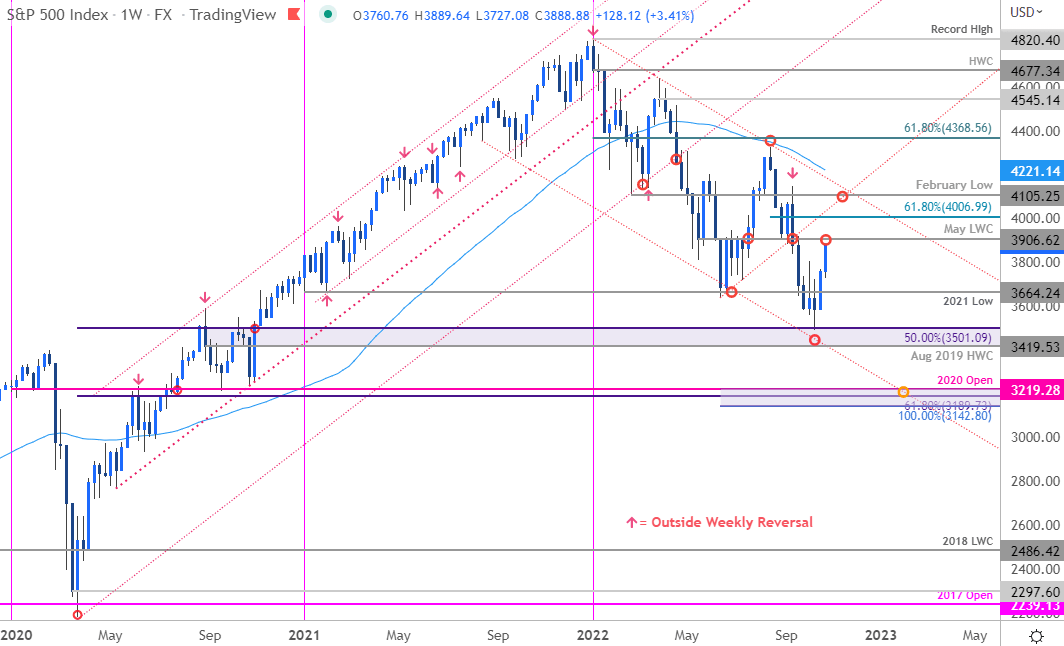
Chart Prepared by Michael Boutros, Technical Strategist; SPX500 on Tradingview
Notes: In my last S&P 500 Weekly Technical Outlook I noted that a the SPX was vulnerable to further losses towards a critical support zone, “at 3419-3501- a region defined by the August 2019 high-week close and the 50% retracement of the 2020 advance.” The index registered a low at 3491 the following week before rebounding with the subsequent rally extending more 11.3% off the lows. Price is now approaching initial resistance around the May low-week close / 100% extension of the October rebound at 3906/07- looking for a reaction off this threshold for guidance.
A topside breach / weekly close above this threshold would keep the focus on subsequent resistance objectives at the 61.8% Fibonacci retracement of the August decline at 4007 and the February swing low at 4105- both zones of interest for possible topside exhaustion IF reached. Initial weekly support rests with the 2021 low at 3664 backed again by 3417-3501- a break lower from here would mark resumption of the broader downtrend towards the next major support zone at 3142-3219.
Bottom line: The S&P 500 recovery is approaching initial resistance objectives and I’m on the lookout for possible topside exhaustion into downtrend resistance. From at trading standpoint, look to reduce long-exposure / raise protective stops on a stretch towards 4100 with a close below 3664 to fuel another test of the lows and beyond. I’ll publish an updated S&P 500 Short-term Technical Outlook once we get further clarity on the near-term SPX500 technical trade levels.
S&P 500 Trader Sentiment – SPX500 Price Chart
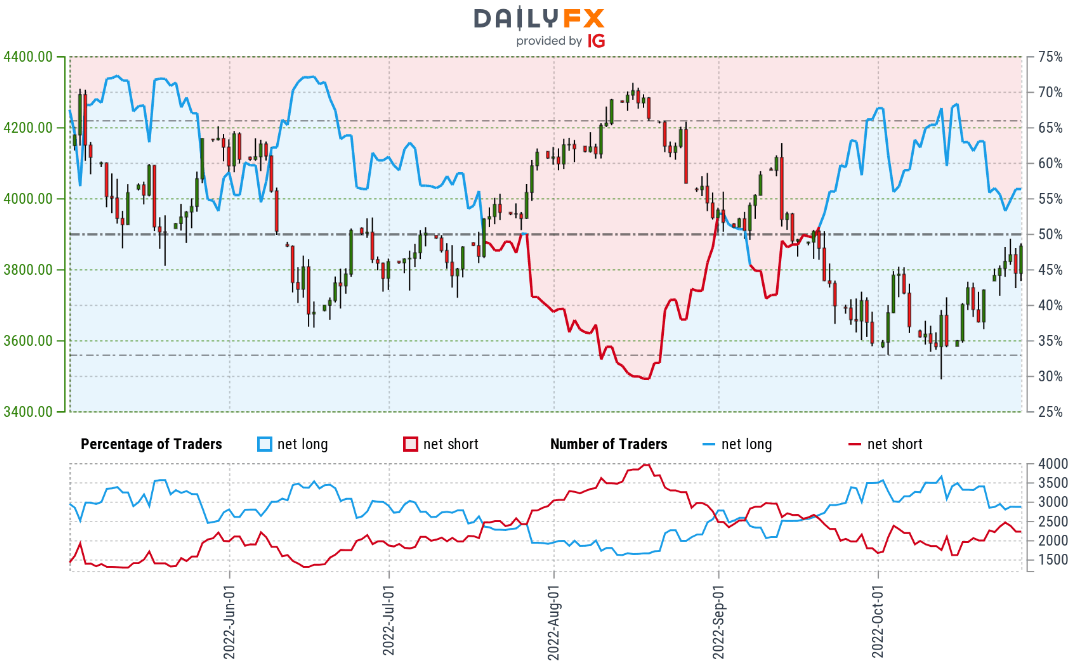
- A summary of IG Client Sentiment shows traders are net-long the S&P 500- the ratio stands at +1.20 (54.55% of traders are long) – typically a weak bearish reading
- Long positions are 0.20% lower than yesterday and 14.68% lower from last week
- Short positions are 2.20% lower than yesterday and 23.28% higher from last week
- We typically take a contrarian view to crowd sentiment, and the fact traders are net-long suggests US 500 prices may continue to fall. Traders are more net-long than yesterday but less net-long from last week. The combination of current positioning and recent changes gives us a further mixed US 500 trading bias from a sentiment standpoint.
| Change in | Longs | Shorts | OI |
| Daily | 6% | -1% | 1% |
| Weekly | 4% | -4% | -2% |
Nasdaq 100 Price Chart – NDX Weekly
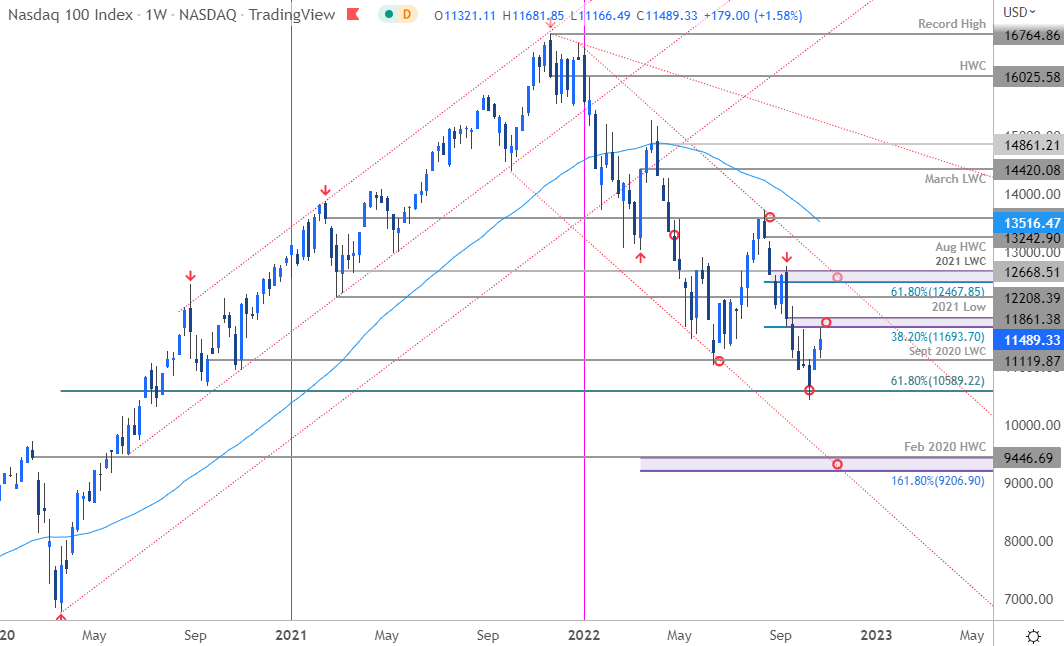
Chart Prepared by Michael Boutros, Technical Strategist; NDX on Tradingview
Notes: Nasdaq rebounded off the 61.8% retracement of the 2020 advance at 10589 (low registered at 10440) before rallying nearly 11.9% off the low. The tech-heavy index has lagged its counterparts and casts a shadow on the sustainability of the current risk rally. That said, the threat remains for a larger recovery near-term within the broader yearly downtrend.
Weekly resistance is eyed at 11693/861 backed by the 2021 low at 12208 and the 61.8% retracement / 2021 low -week close at 12467/668 (bearish invalidation)- both zones of interest for possible topside exhaustion IF reached. Initial weekly support rests with the September 2020 low-week close at 11119 backed again by 10589- a break / weekly close below this threshold would threaten resumption of the broader downtrend towards the next major support zone at 9206-9446.
Bottom line: Nasdaq has rebounded off Fibonacci support with the recovery now approaching initial resistance hurdles. From a trading standpoint, look for a high ahead of yearly channel resistance with a break of the lows needed to fuel the next major leg down in price.
Dow Jones Industrial Average Price Chart – US30 Weekly

Chart Prepared by Michael Boutros, Technical Strategist; US30 on Tradingview
Notes: The Dow Jones Industrial Average surged more than 14.3% off the monthly low with DJI marking the strongest performance of the lot. The rally is now testing confluent resistance at the 50% retracement of the yearly range / January trendline at 32806- looking for possible price inflection into this zone.
A topside breach / close above would suggest a larger reversal is underway with such a scenario exposing the 52-week moving average around ~33247 and the 61.8% retracement / November 2021 low at 33785-34006 (bearish invalidation)- both zones of interest for possible price inflection IF reached. Initial support rests with the September high-week reversal close at 30822 backed by 29794 with key support steady at the 2020 uncovered gap / 2020 August high-close at 28323/653- a break / close below this threshold is needed to mark resumption of the broader downtrend towards the next major support zones at 26982-27583 and the 61.8% retracement at 25371.
Bottom Line: The Dow rally has covered half of the yearly range with the recovery now testing confluent downtrend resistance- looking for a reaction here. From at trading standpoint, a good zone to reduce portions of long-exposure / raise protective stops – losses should be limited to this week’s low IF price is heading higher on this stretch. Ultimately, a larger recovery may offer more favorable opportunities with close below 30822 needed to fuel another run at the lows. Keep in mind we have the FOMC interest rate decision and US non-farm payrolls on tap next week- stay nimble and expect volatility.

For a complete breakdown of Michael’s trading strategy, review his Foundations of Technical Analysis series on Building a Trading Strategy
Active Weekly Technical Setups
- Australian Dollar
- Euro (EUR/USD)
- US Dollar Index (DXY)
- Japanese Yen (USD/JPY)
- British Pound (GBP/USD)
- Canadian Dollar (USD/CAD)
- Gold (XAU/USD)
-Written by Michael Boutros, Technical Strategist with DailyFX
Follow Michael on Twitter @MBForex