

US Stock Indices Technical Forecast: Weekly Trade Levels
- SPX500 support 3419-3501, 3142-3219- resistance 3664, 3734, 3906
- Nasdaq support 10589, 9206-9446 - resistance 11119, 11861, 12668
- Dow support 28323, 26982-27583, 25371- resistance 29794, 30822, 32272
The stock plunge has seen all three major indices plummet more than 22% off the record highs with the S&P 500, Nasdaq and the Dow Jones Industrial Average breaking to fresh yearly lows. While the broader outlook remains weighted to the downside, the declines are now approaching downtrend support and we’re looking for a reaction just lower for guidance. These are the targets and invalidation levels that matter on the S&P 500 (SPX500), Nasdaq (NDX) and the Dow Jones Industrial Average (US30) weekly technical charts. Review my latest Strategy Webinar for an in-depth breakdown of these technical stock setups and much more.
S&P 500 Price Chart – SPX500 Weekly
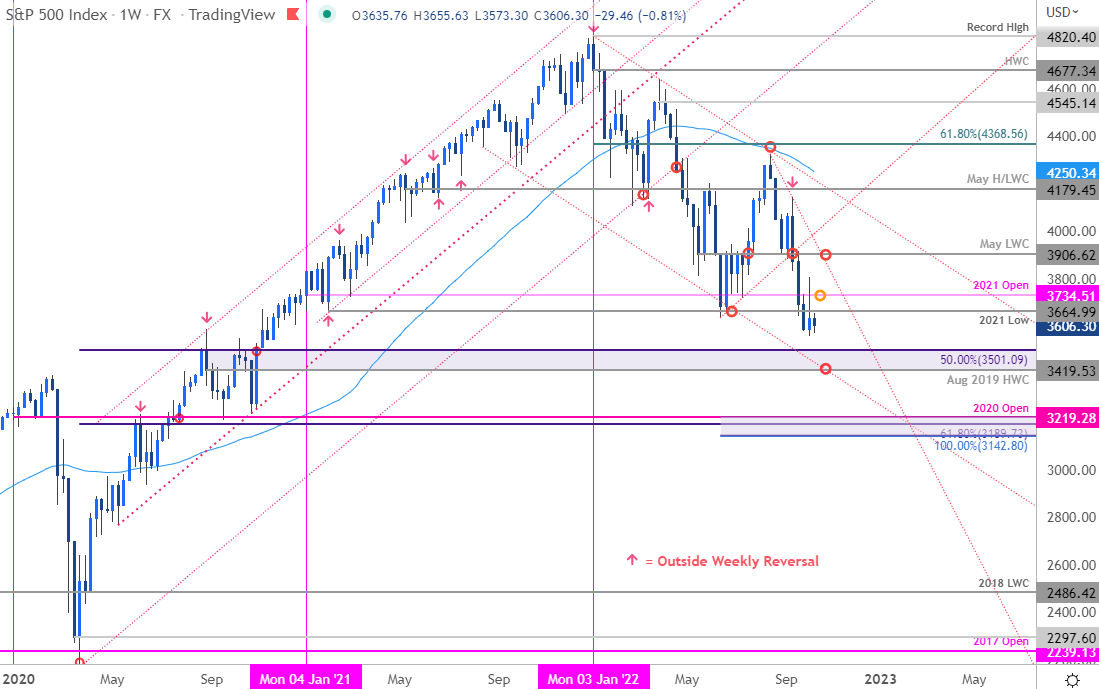
Chart Prepared by Michael Boutros, Technical Strategist; SPX500 on Tradingview
Notes: In last month’s S&P 500 Weekly Technical Outlook I noted that a rebound off near-term confluent support had shifted the focus higher in the SPX and to be on the lookout for topside exhaustion, “ahead of 4179 IF price is indeed heading lower here with a break threatening another run toward the yearly lows.” The index registered a high at 4145 the following week before posting an outside weekly-reversal with the subsequent decline taking out the yearly lows.
Key weekly support remains unchanged at 3419-3501- a region defined by the August 2019 high-week close and the 50% retracement of the 2020 advance. Note that basic channel support converges on this threshold over the next few weeks – look for a larger reaction there IF reached with a weekly-close below threatening a plunge towards more significant support at the confluence of the 100% extension of the yearly decline, the 61.8% Fibonacci retracement of 2020 rally and the object 2020 yearly open at 3142-3219.
Initial resistance eyed at the 2021 low at 3664 backed closely by the 2021 yearly open at 3734. Broader bearish invalidation now lowered to the May low-week close at 3906- a breach / weekly close above would be needed to suggest a more significant low is in place.

Bottom line: The S&P 500 breakdown to fresh yearly lows remains vulnerable to further losses in the days ahead. From a trading standpoint, rallies should be limited to the August trendline IF price is heading lower on this stretch with a break from here exposing 3419-3501. I’ll publish an updated S&P 500 Short-term Technical Outlook once we get further clarity on the near-term SPX500 technical trade levels.
S&P 500 Trader Sentiment – SPX500 Price Chart
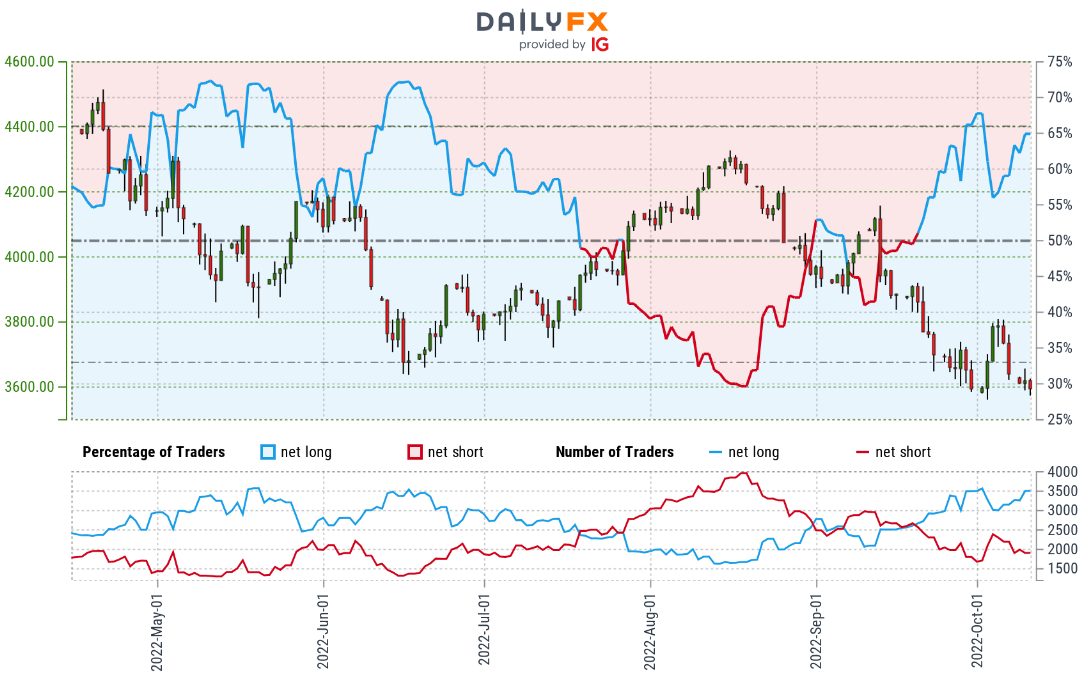
- A summary of IG Client Sentiment shows traders are net-long the S&P 500- the ratio stands at +1.82 (64.54% of traders are long) – typically a bearish reading
- Long positions are 5.18% higher than yesterday and 5.59% higher from last week
- Short positions are 5.56% lower than yesterday and 7.97% lower from last week
- We typically take a contrarian view to crowd sentiment, and the fact traders are net-long suggests SPX500 prices may continue to fall. Traders are further net-long than yesterday and last week, and the combination of current positioning and recent changes gives us a stronger S&P 500-bearish contrarian trading bias from a sentiment standpoint.
| Change in | Longs | Shorts | OI |
| Daily | -9% | -1% | -4% |
| Weekly | 4% | -4% | -1% |
Nasdaq 100 Price Chart – NDX Weekly
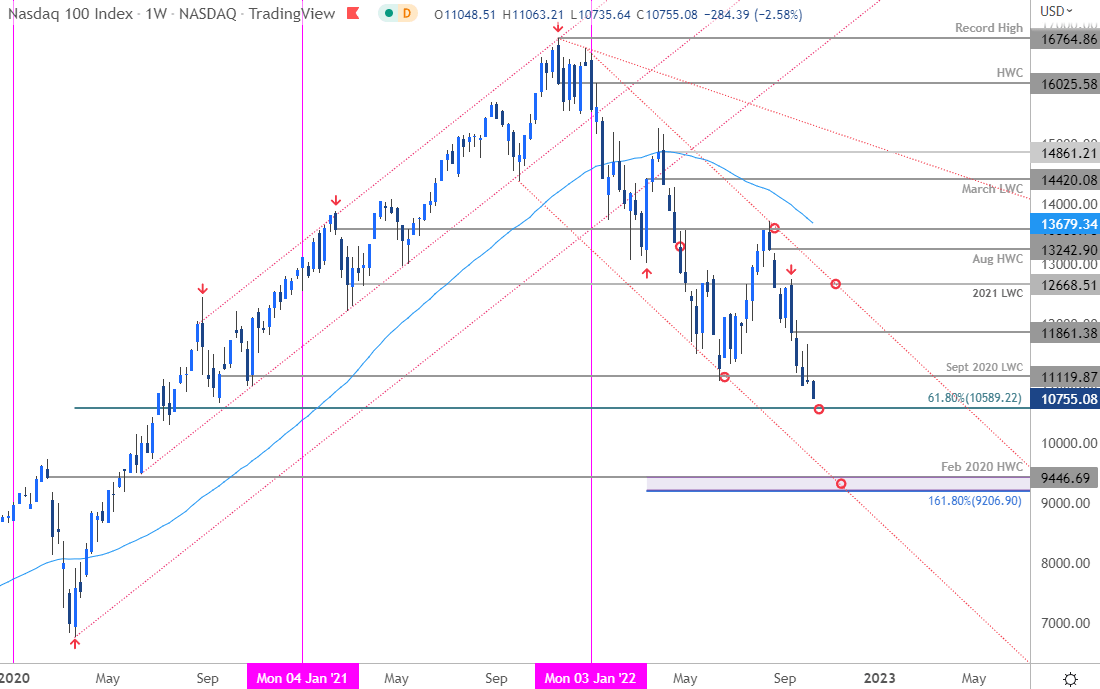
Chart Prepared by Michael Boutros, Technical Strategist; NDX on Tradingview
Notes: Nasdaq has plunged more than 21.7% off the August highs with a break of the yearly lows now approaching the next major support zone at the 61.8% retracement of the 2020 advance at 10589- looking for a reaction / possible inflection here. A break / weekly-close below this threshold would threaten a much steeper decline in the index with such a scenario exposing the 1.618% extension / February 2020 high-week close at 9206-9446. Initial resistance now back at the September 2020 low-week close at 11119 backed by the September high-week reversal close at 11861. Broader bearish invalidation now lowered to the 2021 low-week close at 12668.
Bottom line: Nasdaq is approaching Fibonacci support just lower and we’re looking for a reaction on a possible stretch towards 10589. From at trading standpoint, rallies should be limited by 11861 IF price is heading lower with a break here risking the next leg of the broader downtrend.
Dow Jones Industrial Average Price Chart – US30 Weekly
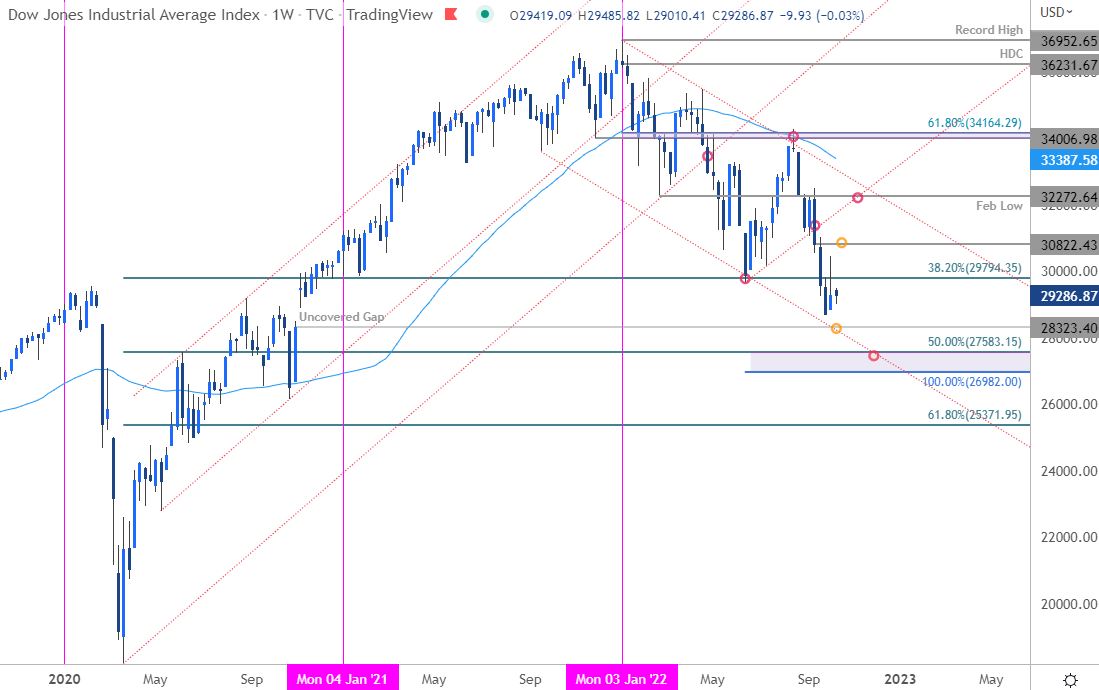
Chart Prepared by Michael Boutros, Technical Strategist; US30 on Tradingview
Notes: The Dow Jones Industrial Average broke below Fibonacci support last month with the index now approaching the lower bounds of the yearly downtrend (channel support). Weekly support rest with the 2020 uncovered gap at 28323 backed by 26982-27583- a region defined by the 50% retracement of the 2020 advance and the 100% extension of decline off the yearly / record high. Note that losses beyond this threshold could fuel another bout of accelerated losses with such a scenario exposing the 61.8% retracement at 25371. Initial weekly resistance stands at 29791 backed by the September high-week reversal close at 30822. Broader bearish invalidation now lowered to the objective February low at 32272.
Bottom Line: The Dow sell-off is now approaching yearly downtrend support- looking for a reaction just lower. From at trading standpoint, rallies should be limited to 30822 IF price is heading lower on this stretch with a break lower keeping the focus on subsequent objectives into channel support.
For a complete breakdown of Michael’s trading strategy, review his Foundations of Technical Analysis series on Building a Trading Strategy
Active Weekly Technical Setups
- US Dollar Index (DXY)
- British Pound (GBP/USD)
- Canadian Dollar (USD/CAD)
- Euro (EUR/USD)
- Gold (XAU/USD)
- Crude Oil (WTI)
- Australian Dollar (AUD/USD)
- Japanese Yen (USD/JPY)
-Written by Michael Boutros, Technical Strategist with DailyFX
Follow Michael on Twitter @MBForex