
USD Technical Outlook
- US Dollar Index (DXY) reversed aggressively from long-term slope
- First time we have seen real vulnerability in a while, larger slide could unfold
{{AD}}
US Dollar Technical Analysis: Reversal Week Puts Brakes on Upside, for Now
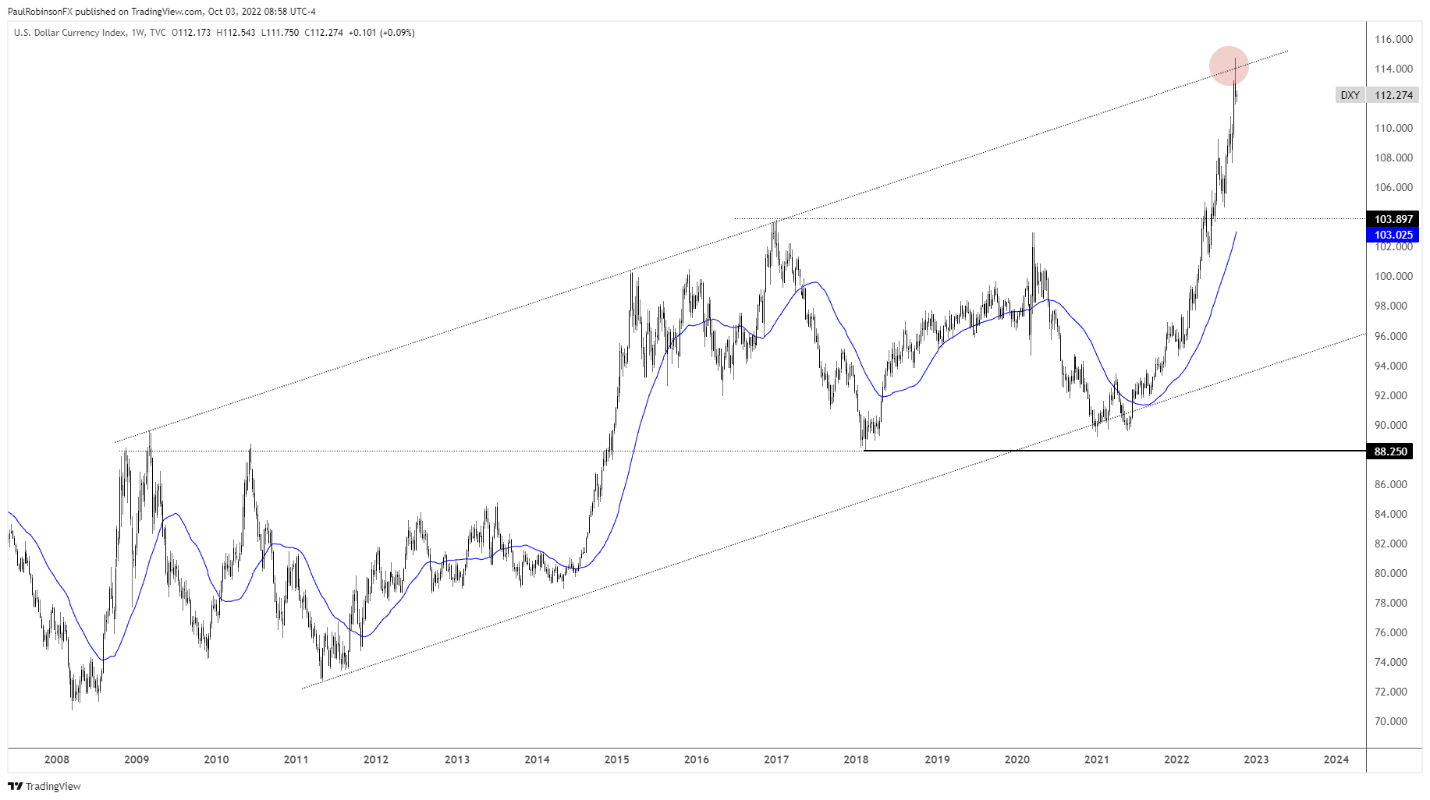
Last week the US Dollar Index (DXY) traded up to a long-term slope where price reversed sharply from following panicky price action in cable. The slope dates to 2009, where there were yearly highs posted in 2015 and 2017.
The price action around the slope last week was violent, with the DXY initially trading above it only to close significantly below it. This furthers the threshold as a meaningful line of resistance. As the new week gets started if the dollar is to try and reassert itself and make a run on last week’s high it will need to get its footing early it would seem.
Stocks are in a vulnerable spot around the June lows and this would be the time for the dollar to hold and start working its way higher. If, however, we don’t see this unfold then we could be in for a bit of a dollar retreat and stock stabilization.
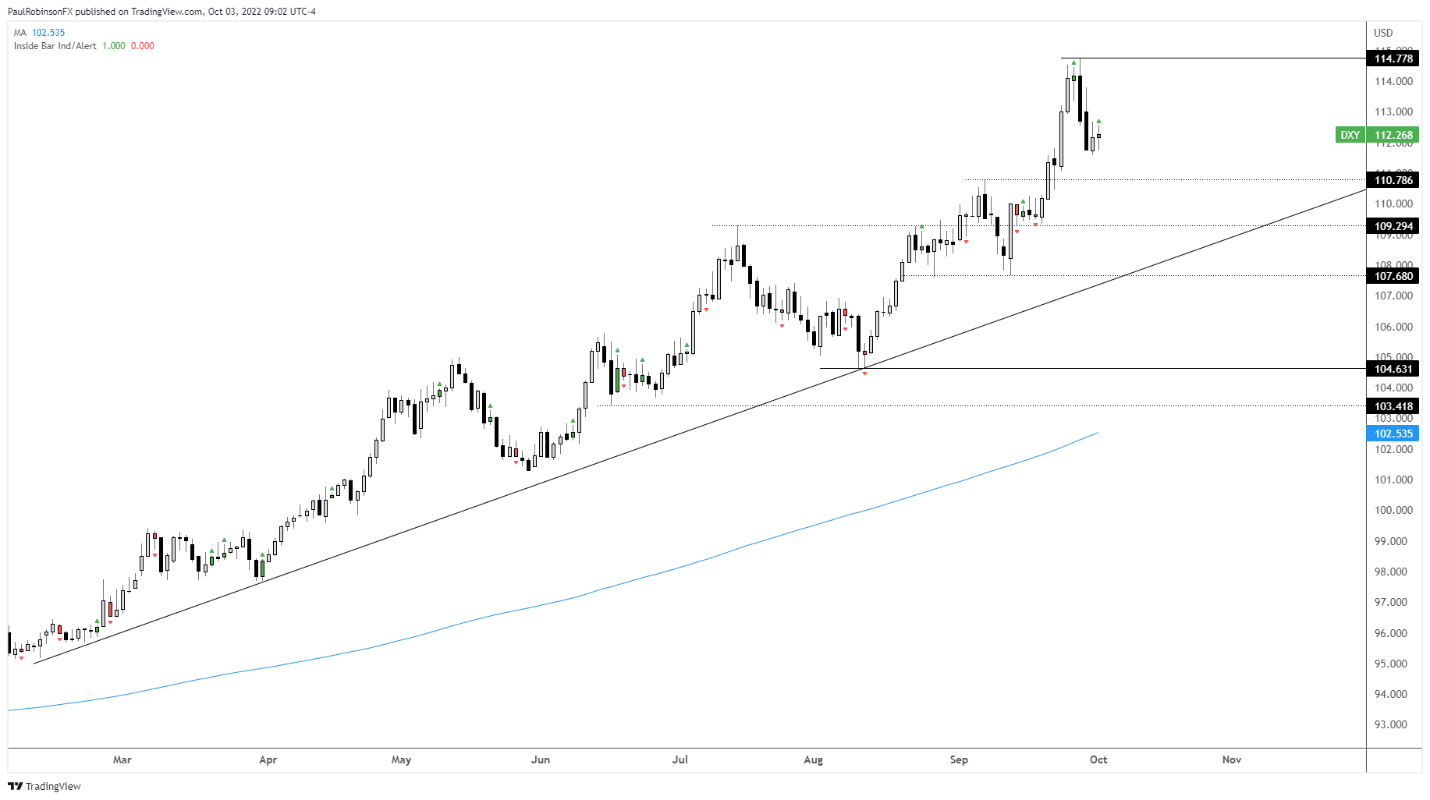
On the downside the 11078 level comes in not too far below, this was a swing-high created in early September. Followed by that is 10929, then if things got really aggressive we would be looking to the slope running up from February.
On the top-side the only real big level at this juncture is the is the 11478 high. Trading around that level would get interesting as a failure to climb above the strong reversal high could set off another strong push back lower. A breakout above would have the slope in the rear-view mirror and focus on the 2001 high at 12100.
{{GUIDE|TOP|Check out the top trades for this quarter!}}
US Dollar Index (DXY) Weekly Chart
US Dollar Index (DXY) Daily Chart
Resources for Forex Traders
Whether you are a new or experienced trader, we have several resources available to help you; indicator for tracking trader sentiment, quarterly trading forecasts, analytical and educational webinars held daily, trading guides to help you improve trading performance, and one specifically for those who are new to forex.
---Written by Paul Robinson, Market Analyst
You can follow Paul on Twitter at @PaulRobinsonFX