
US Dollar Technical Price Outlook: DXY Weekly Trade Levels
- US Dollar technical trade level update – Weekly Chart
- USD rally vulnerable below uptrend resistance – threat for correction remains
- DXY support 109.64, 108.09/74, 104.88-105– Resistance 114.78-115.29, 116.20s, 119.91
The US Dollar Index snapped a two-week winning streak with the DXY slipping 1% to trade at 112.174 ahead of the New York close on Friday. An outside-weekly reversal casts a bearish tone for the Dollar with the index vulnerable to a pullback off uptrend resistance. These are the updated technical targets and invalidation levels that matter on the US Dollar Index weekly price chart. Review my latest Strategy Webinar for an in-depth breakdown of this DXY technical setup and more.
US Dollar Index Price Chart – DXY Weekly
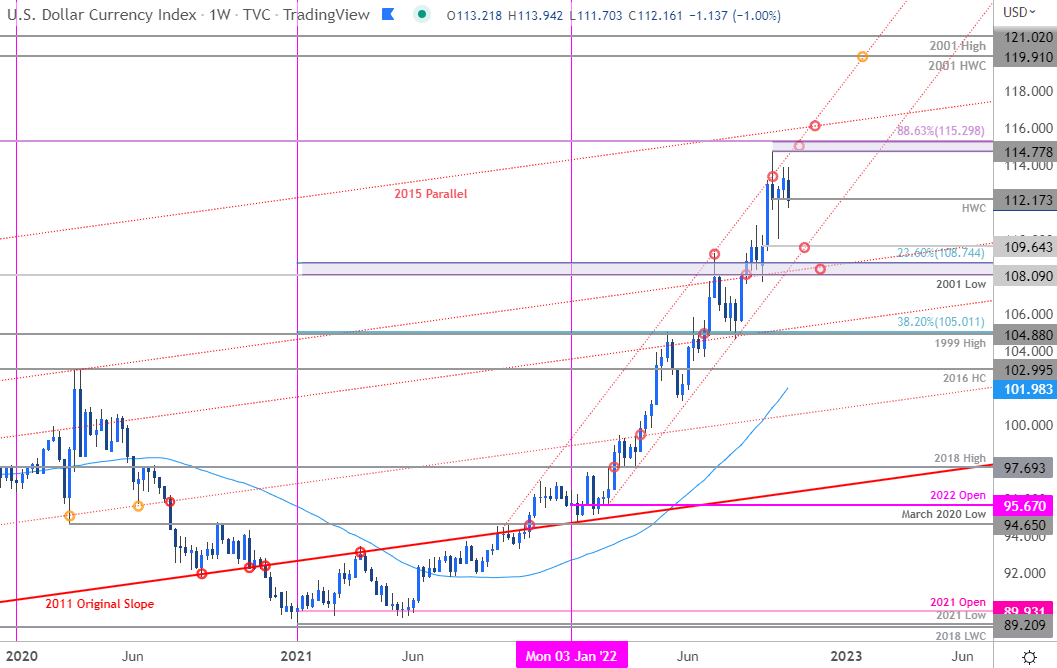
Chart Prepared by Michael Boutros, Technical Strategist; US Dollar Index on Tradingview
Notes: In my last US Dollar Weekly Price Outlook I noted that, “While the broader outlook remains constructive, the risk remains for a deeper correction before resumption of the broader trend. From a trading standpoint, the focus is higher while above 108 with a breach / close above channel resistance needed to fuel the next leg in price.” Nearly two-weeks later and the index continues to hold just below slope resistance and the threat of a correction off this level remains.
Initial weekly support now eyed at the yearly high-week close at 112.17 backed by the September low-week reversal-close at 109.64. Key support / medium-term bullish invalidation steady at the 2001 low / 23.6% retracement of the 2021 rally at 108.09/74- weakness beyond this threshold would suggest a more significant high was registered last month.
Topside resistance remains unchanged at the yearly high / 88.6% Fibonacci retracement of the 2001 decline at 114.78-115.29 backed closely by the highlighted trendline confluence near ~116.20s. Ultimately a close above the 2015 parallel would be needed to fuel the next leg higher in price with such a scenario exposing the 2001 high-week close at 119.91 and that same yearly swing high at 121.02.
For a complete breakdown of Michael’s trading strategy, review his Foundations of Technical Analysis series on Building a Trading Strategy
Bottom line: While the broader US Dollar outlook remains constructive, the immediate advance may be vulnerable here after responding to uptrend resistance. From a trading standpoint, a good zone to reduce long-exposure / raise protective stops. Ultimately, losses should me limited by the February trendline IF price is indeed heading higher on this stretch with a close above this channel needed to clear the way for the next major leg higher. I’ll publish an updated US Dollar Short-term Price Outlook once we get further clarity on the near-term DXY technical trade levels.

US Economic Calendar
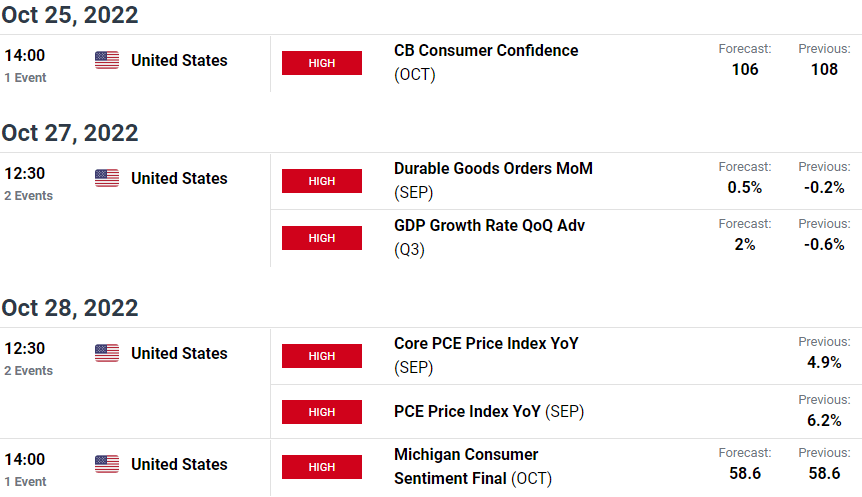
Economic Calendar - latest economic developments and upcoming event risk.
Active Weekly Technical Charts
- Japanese Yen (USD/JPY)
- British Pound (GBP/USD)
- Canadian Dollar (USD/CAD)
- Gold (XAU/USD)
- S&P 500, Nasdaq & Dow
- US Dollar Index (DXY)
- Euro (EUR/USD)
--- Written by Michael Boutros, Technical Strategist with DailyFX
Follow Michael on Twitter @MBForex