USD Technical Analysis
- EUR/USD rides the post CPI wave higher. Euro longs (CoT report) continue to ease
- Cable runs the risk of overheating after UK election, US CPI catalysts
- AUD momentum slows after Chinese economy takes a step back
- Elevate your trading skills and gain a competitive edge. Get your hands on the U.S. dollar Q3 outlook today for exclusive insights into key market catalysts that should be on every trader's radar:

EUR/USD Rides the Post US CPI Wave Higher
With the French legislative elections behind us the euro has enjoyed renewed vigor – largely off the back of a sharp dollar decline as the expectation of a Fed cut in September is almost fully priced in.
EUR/USD has risen around 250 pips from the late June low, taking out the 50 and 200-day simple moving averages (SMA) with ease. The pair now has a major resistance zone in its sight – the zone between 1.0942 and 1.0960. The two levels correspond with the 50% and 61.8% Fibonacci retracements of the 2021 -2022 descent and the 2023 major decline. The zone of resistance has contained bullish momentum for most of this year with just two momentary breaches – albeit on an intra-day basis only.
Bullish momentum may encounter resistance ahead of the major zone after tagging the June swing high 1.0916, with the RSI indicator getting perilously close to overbought territory.
Jerome Powell’s speech later this afternoon may assist EUR/USD if he maintains the slightly dovish tone he adopted during his two-day testimony last week. However, tomorrow’s potentially softer ZEW economic sentiment could weigh on the pair which could aid a pullback.
EUR/USD Daily Chart
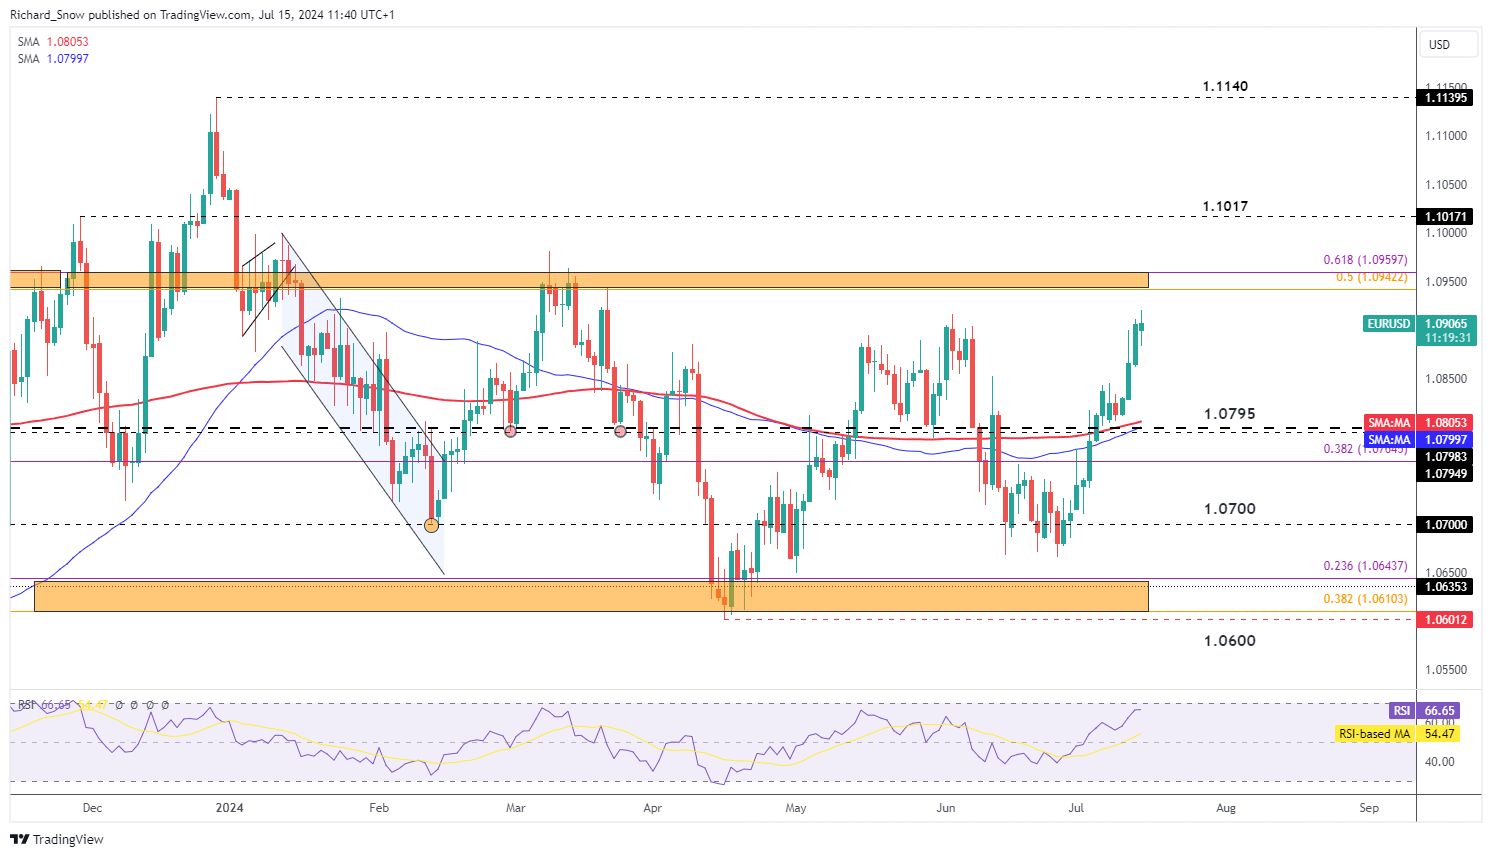
Source: TradingView, prepared by Richard Snow
EUR/USD positioning shows a notable lack of bullish appetite, which is understandable given the lower path of interest rate expectations and the uncertainty surrounding French elections.
The picture may be different next week as current positioning data does not take into account any movements either side of the US CPI print.
EUR/USD Chart Alongside Speculative Positioning Data from the CFTC
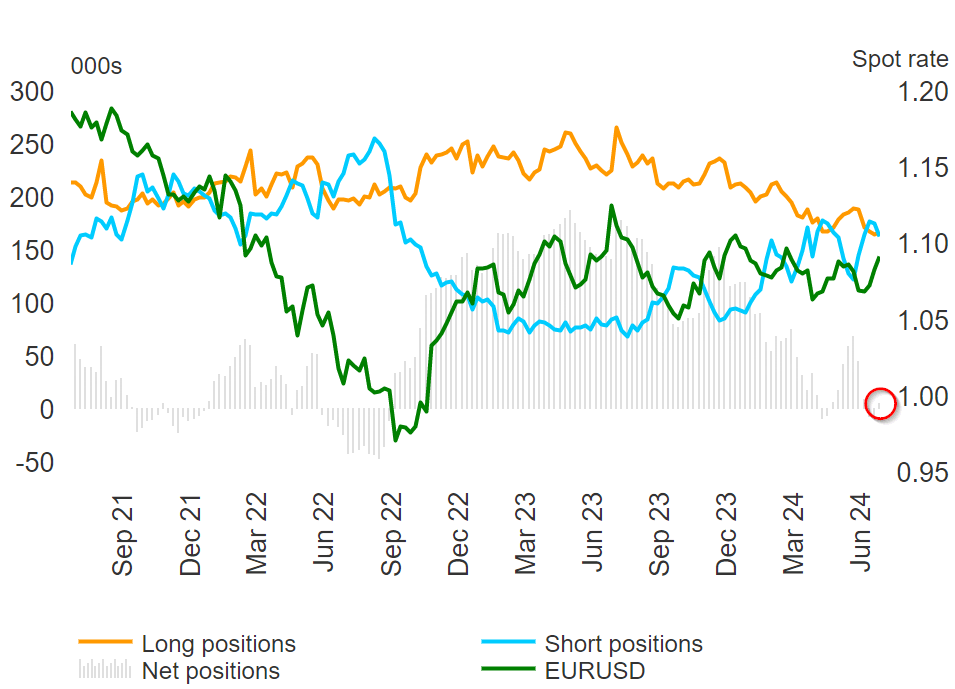
Source: CFTC, CoT report, prepared by Richard Snow

Cable Runs the Risk of Overheating after UK Election, US CPI Catalysts
GBP/USD has surged by more than 350 pips since the late June swing low. The UK election result was largely academic as poles indicated a landslide victory for the Labour Party. Markets despise uncertainty which is why UK assets responded favourably after the result was announced.
The sharp dollar selloff has only strengthened the bullish move in cable, catapulting the pair to a new yearly high. The next significant level of resistance appears at the July 2023 swing high of 1.3142 but the risk of overheating has become more apparent now that the RSI looks to recover from overbought territory. It is not unusual for markets to take a breather after such a rapid rise, meaning a short term correction cannot be ruled out at this stage.
GBP/USD Daily Chart
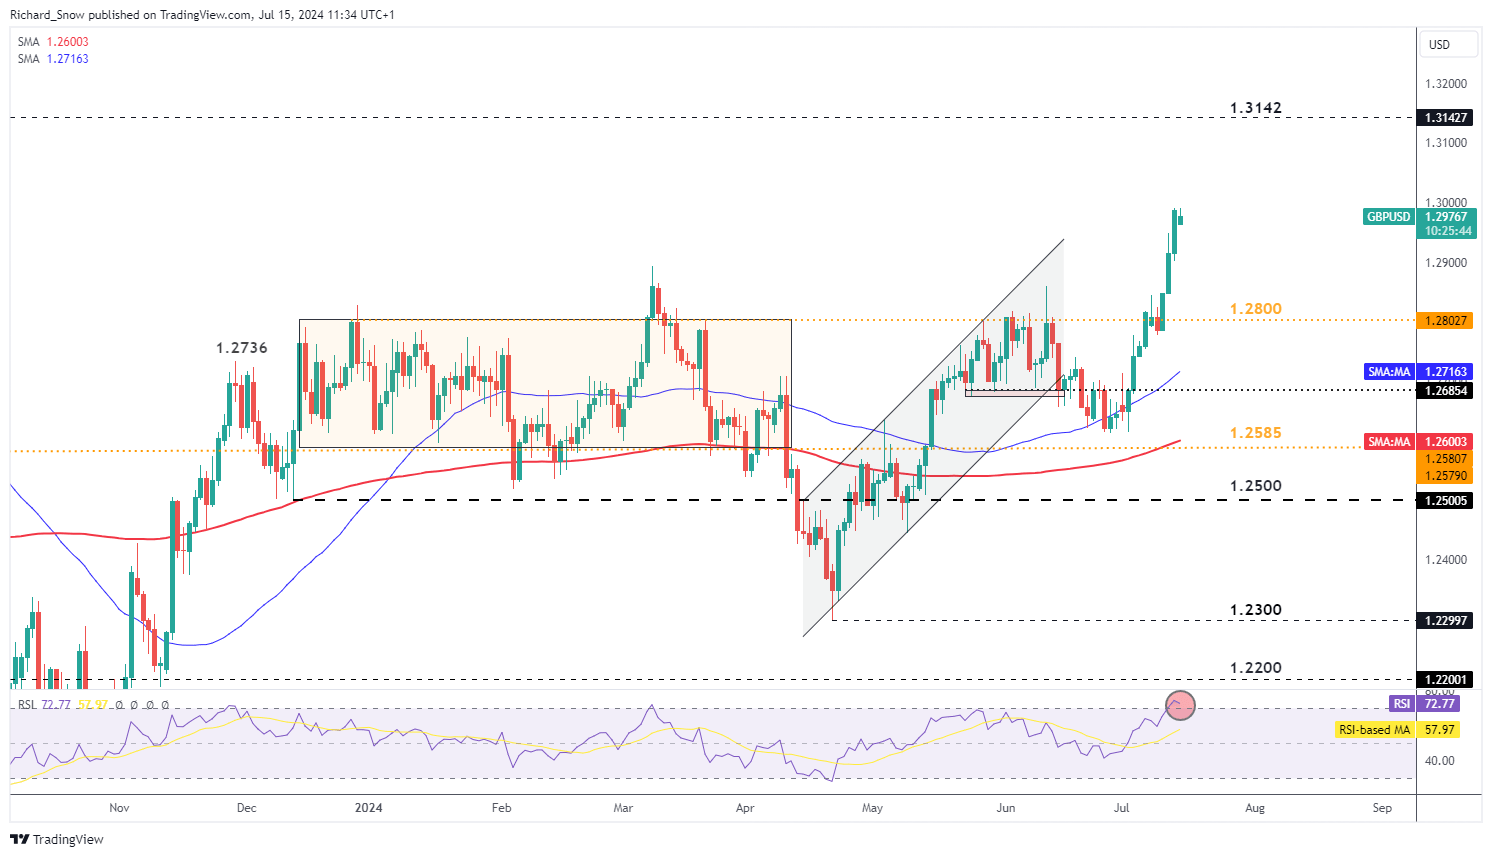
Source: TradingView, prepared by Richard Snow
Speculative longs entered into by large speculators and hedge funds obliged to disclose their positions to the CFTC surged – widening the gap between longs and shorts. There has been a clear preference for sterling with longs increasing sharply while shorts remain subdued. The recent dollar decline has helped unveil the pound as one of the major winners in the FX space.
Sterling Longs Accelerate to Widen Net-Long Positioning
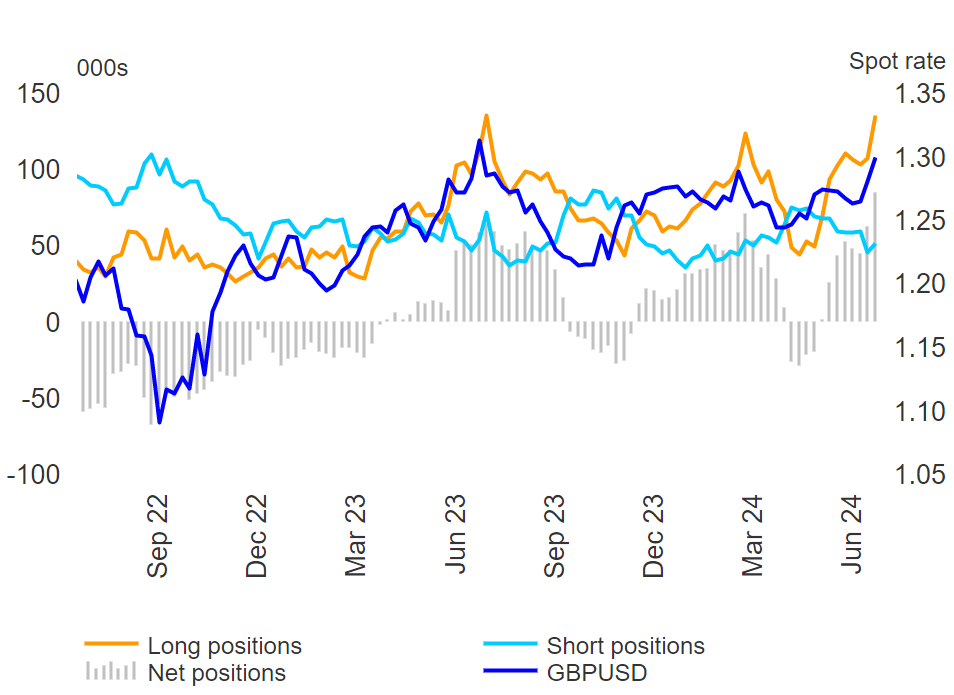
Source: CFTC, CoT report, prepared by Richard Snow
Curious to learn how market positioning can affect asset prices? Our sentiment guide holds the insights—download it now!
| Change in | Longs | Shorts | OI |
| Daily | -7% | 9% | 3% |
| Weekly | -28% | 28% | 3% |
AUD Momentum Slows After Chinese Economy Takes a Step Back
Chinese GDP grew by less than expected in Q2 when compared to Q2 of last year and also grew by 0.7% compared to Q1 2024, missing the estimate of 1.1% and coming in lower than the 1.5% figure in Q1 2024.
The worse-than-expected data could impact the bullish advance in AUD/USD at a time when risk assets have held up rather well. The Aussie dollar tends to track the S&P 500, which has had a great year thus far in 2024 thanks to a handful of stocks. The Fed is also expected to cut rates for the first time since initiating the rate hiking cycle as early as September which contrasts thinking at the Reserve Bank of Australia (RBA) in the face of stubborn inflation.
A positive and rising interest rate differential between Australia and the US is helping keep the Aussie elevated but the pair recently entered overbought territory, opening up the possibility of a short-term pullback. A potential level of support appears at 0.6730 with an upside extension appearing at the late December high of 0.6870 should the bullish momentum achieve another leg higher.
AUD/USD Daily Chart
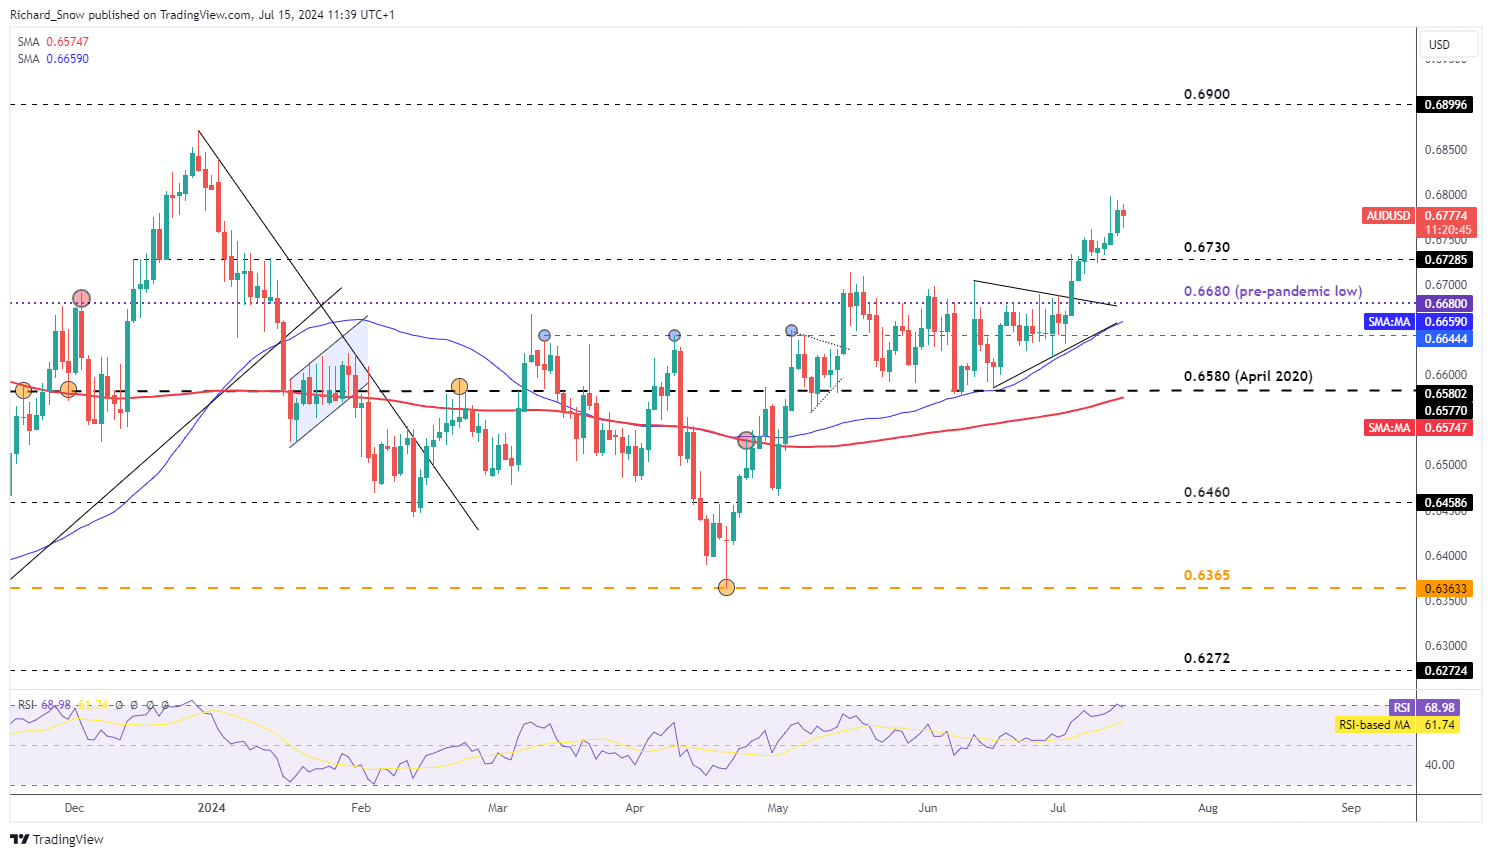
Source: TradingView, prepared by Richard Snow
AUD sentiment has recently shifted positive (net-long) as shorts stagnate and longs accelerate on the recent interest rate differential between Australia and the US.
AUD/USD with Corresponding, Speculative Long and Short Positioning
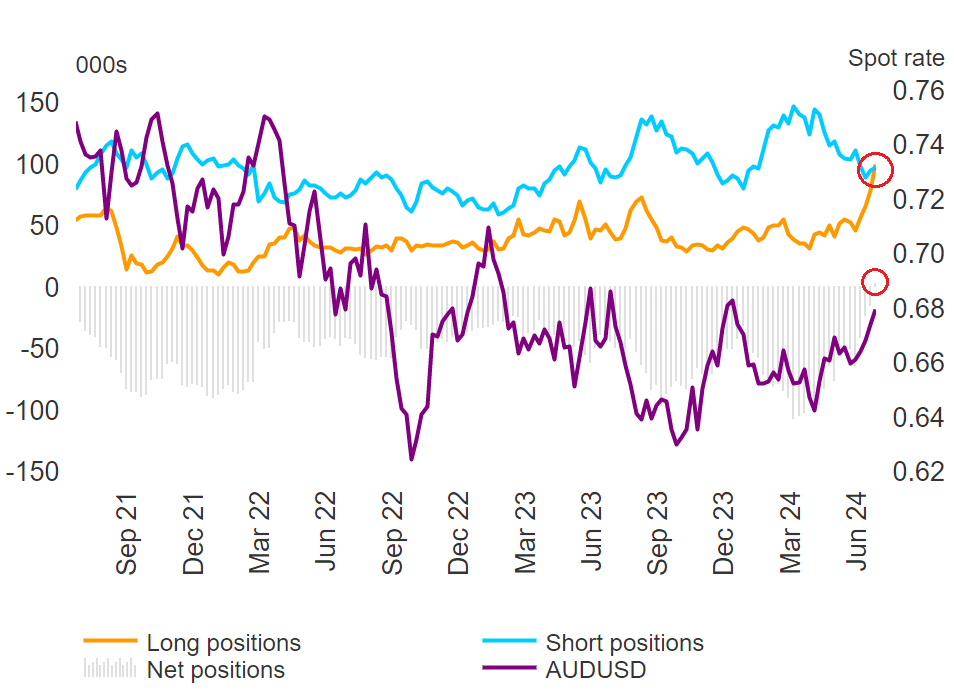
Source: CFTC, CoT report, prepared by Richard Snow
--- Written by Richard Snow for DailyFX.com
Contact and follow Richard on Twitter: @RichardSnowFX