
Talking Points – Argentine Peso, Turkish Lira, Brazilian Real, South African Rand, Russian Ruble, Indian Rupee
- Fed rate hikes, trade war fears and emerging market contagion concerns rattled developing nations
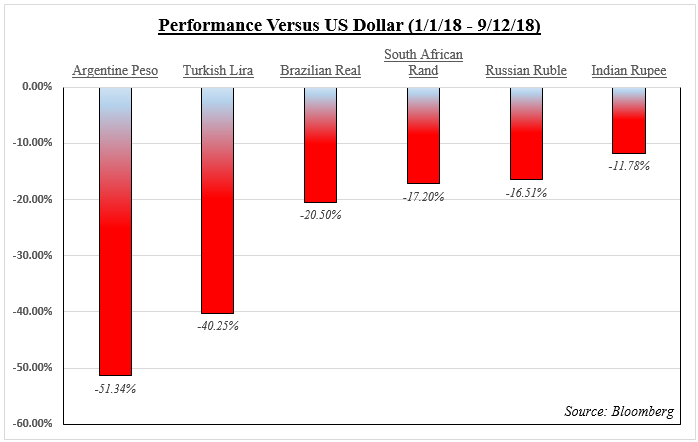
- Since the beginning of 2018, the Argentine Peso declined over 50% while Indian Rupee fell over 11%
- We observe the outlook for USD/ARS, USD/TRY, USD/BRL, USD/ZAR, USD/RUB and USD/INR
See our study on the history of trade wars to learn how it might influence financial markets!
Emerging markets have become a hot topic for policymakers and investors as fears of contagion and tightening global credit conditions resulted in acute depreciation of their currencies. Below, you can see the impact of those concerns on the Argentine Peso, Turkish Lira, Brazilian Real, South African Rand, Russian Ruble and Indian Rupee since September 12th.
This is a primer that will offer a brief fundamental and technical overview on each highlighted currency. A vulnerability that applies to all of them is the Fed continuing to raise interest rates into 2019. This makes refinancing debt more expensive while offering the US Dollar more gains against its FX peers. At the moment, the central bank is expected to raise rates two more times by 2019 with three more to come by 2020.
Another broad risk that can dampen market mood, sending the MSCI Emerging Markets ETF lower, are trade wars. The markets have brushed off some of those concerns after US President Donald Trump officially announced softer-than-expected $200b Chinese tariffs that will take into effect on September 24th. But reduced trade activity could carry negative implications for some of these economies in the long-run.
With that in mind, we will begin this overview with the country which has experienced arguably some of the most aggressive currency depreciation, Argentina.
Argentine Peso Fundamental Outlook
Like most of these countries, Argentina has a large current account deficit which has been widening and now stands at a record -$9.623b in the first quarter of 2018. Accompanying this was a rise in their external debt. The challenge Argentina faces is that significant depreciation in their currency makes it more expensive to repay their lenders.
Fears were amplified after Argentina’s President Mauricio Macri requested the International Monetary Fund (IMF) to speed up disbursement of a $50b loan to help reduce the nation’s economic crisis. In one day, USD/ARS rose over 12 percent as traders lost confidence in their currency. Ahead, the road for the Argentine Peso will depend on if Macri’s austerity measures (export taxes, cutting subsidies) can balance the budget by next year’s election.
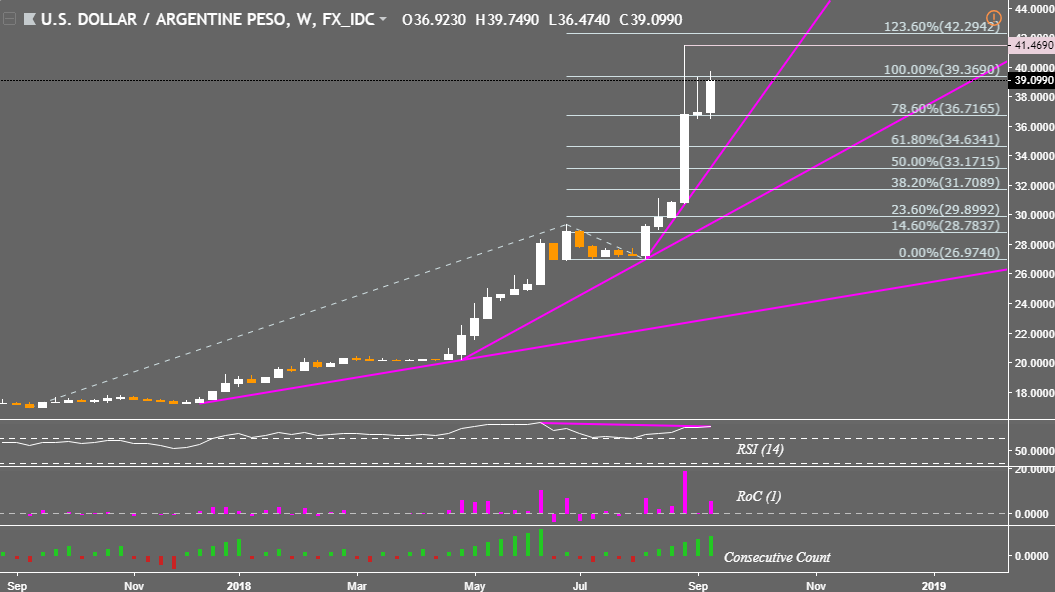
Since Mr. Macri’s request to the IMF, USD/ARS continued rising on the weekly chart but highs achieved on that day have yet to be tested. A push above 41.46 would expose the 123.6% Fibonacci extension while a pullback to support could see the pair eventually testing the rising trend line from August. Steep negative RSI divergence warns the uptrend could be running out of momentum.
USD/ARS Weekly Chart
Turkish Lira Fundamental Outlook
Before Argentina worries picked up pace, Turkish contagion fears arguably amplified the selloff in emerging markets. Back in August, the ECB mentioned its concern about European banking exposure to Turkey. Donald Trump then announced additional metal tariffs on the country over the detained US pastor. These combinations sent the Turkish Lira depreciating over 25 percent against the US Dollar.
Since then, Turkey’s central bank has stepped in and raised interest rates despite calls from President Recep Tayyip Erdogan to lower them. This pulled USD/TRY further away from the record high of 7.2069 achieved in mid-August to near-term support at 5.9752. A descent through this could open the door to test the 38.2% Fibonacci retracement at 5.7483 if the central bank continues tightening monetary policy. Should the country consider releasing the US pastor, this may lift some of Trump’s sanctions which could further bolster the Lira.
USD/TRY Weekly Chart

Brazilian Real Fundamental Outlook
Not long ago, Brazil climbed out of its worst recession back in 2017, but growth is only slowly chugging along. This has allowed for inflation to slow as a side effect. The depreciation in the Brazilian Real alongside other emerging markets currencies has helped to somewhat slow the trend in decelerating prices. In the event these units continue depreciating on emerging market contagion fears, Brazil inflation rates could be lifted.
That would place pressure on the central bank to perhaps raise interest rates to tame CPI, but this could be at the risk of sending the country back into a recession. Meanwhile, the Brazilian election is in October with an unpredictable outcome anticipated in part due to undecided voters. Until the results are in, it is hard to say where policies may go and the uncertainty dampens the appeal of BRL in the interim.
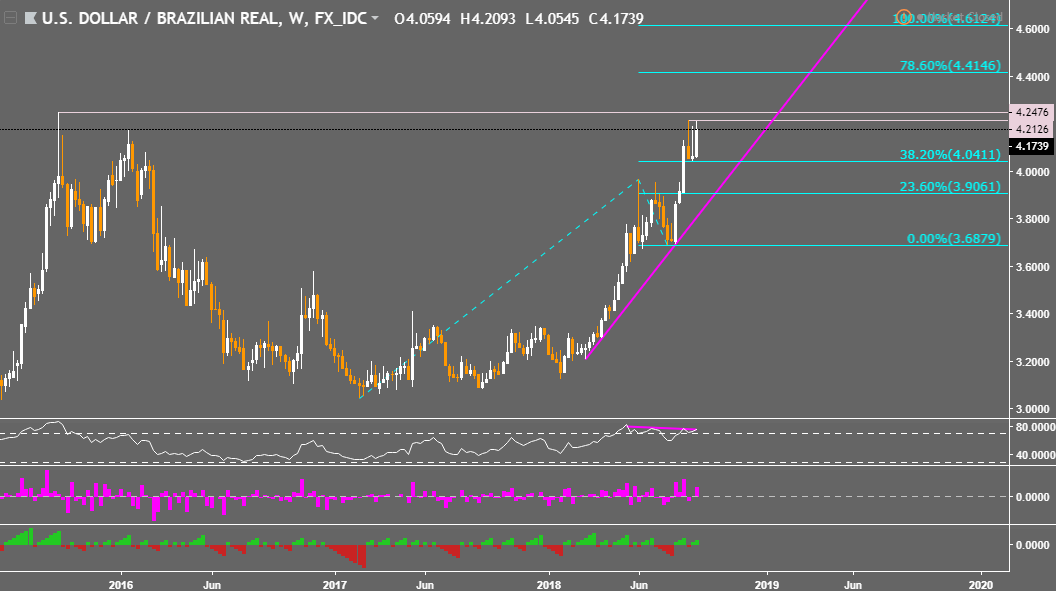
With that in mind USD/BRL could get above the 2015 high at 4.2476 in the long run which would be a record. However, negative RSI divergence on the weekly chart warns that upside momentum is ebbing. This warns that the pair’s next leg could be lower and immediately in the way as support is the 38.2% Fibonacci extension at 4.0411. Not far below that is a rising trend line from March.
USD/BRL Weekly Chart
South African Rand Fundamental Outlook
Amidst emerging market contagion fears as the Turkish Lira and Argentine Peso depreciated, South Africa’s economy entered a recession on September 4th after GDP contracted for two consecutive quarters. The South African Rand depreciated the most in a single day against the US Dollar since November 2016 and in the aftermath touched its weakest point since June of that same year.
The economy has been under pressure with the unemployment rate hovering at 27.2% for Q2 2018. President Cyril Ramaphosa and the ruling African National Congress have implemented fiscal policies to aid growth. This came at a cost of a higher budget deficit which sparked fears that Moody’s could downgrade the country’s credit rating. Even so, the agency announced that there is a small chance that this would happen.
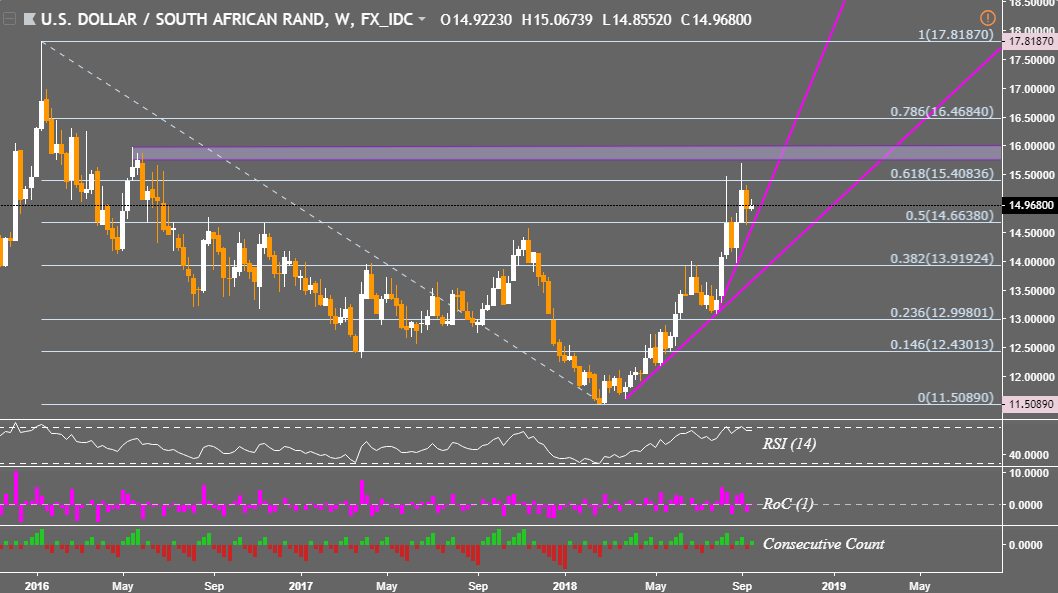
Curiously, Ramaphosa noted recently that he has no plans for mass public sector job cuts. This could continue pressuring the budget deficit which could offer an argument for Moody’s to reassess their outlook. This report is due on October 12th and the country faces elections next year. Prolonged uncertainty and emerging market fears may see USD/ZAR prices retest range support between 15.76 and 15.98.
USD/ZAR Weekly Chart
Russian Ruble Fundamental Outlook
For the most part, Russia’s current account has been in positive territory over the past ten years. Yet, the Ruble has also fallen victim to depreciation alongside other emerging market currencies. This is also despite a general rise in crude oil prices which have been picking up pace since the latter half of 2017. USD/RUB often inversely follows the commodity as it is a key source of revenue for the nation and thus economic growth.
This highlights the Russian Ruble’s vulnerability to emerging market contagion fears despite improving economic fundamentals. The nation has climbed out of a recession which plagued Russia between 2014 and 2017. Yet, USD/RUB has recently come off of its highest point since March 2016 as the central bank of Russia unexpectedly hiked rates for the first time since 2014 adding that they ‘are not’ excluding further ones down the road.
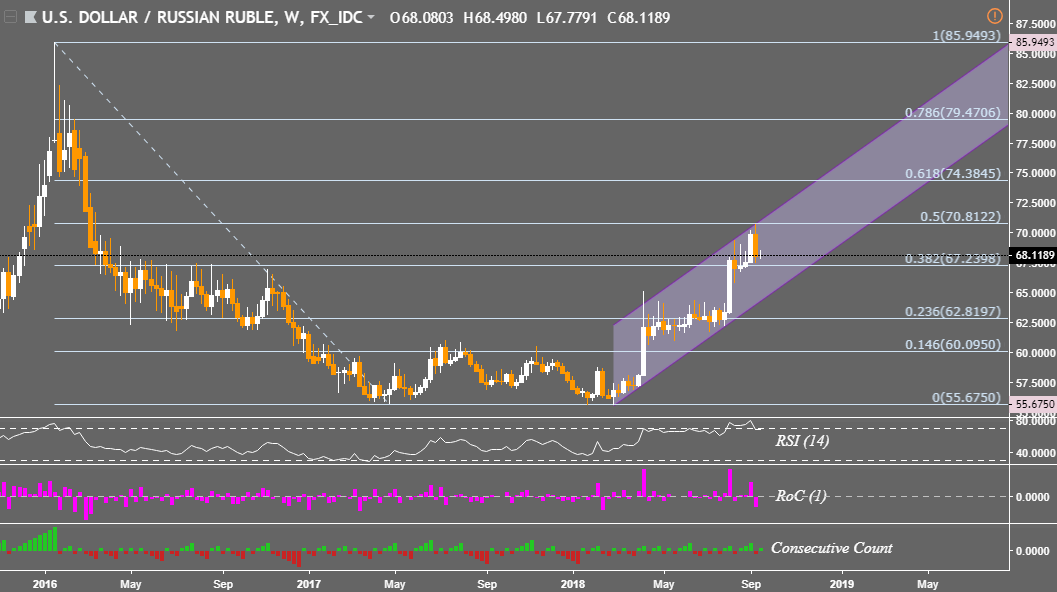
While this may help to alieve some Ruble depreciation, we may see external forces continuing driving down the currency (hawkish Fed & trade wars). In this case, USD/RUB could retest the upper line of an ascending channel from February. This also places key resistance as the 50% midpoint of the Fibonacci retracement at 70.81. Meanwhile a descent through 67.23 exposes the lower line of the rising channel.
USD/RUB Weekly Chart
Indian Rupee Fundamental Outlook
Rising crude oil prices have also partially attributed to India’s current account deficit widening to $15.8b in the second quarter of 2018. This was the largest one since Q2 2013. This is because petroleum is a key import for the country and rising prices helped push the trade balance deeper into negative territory. Versus the US Dollar, the Indian Rupee has depreciated over 11 percent this year as USD/IDR touched record highs.
The Reserve Bank of India (RBI) has been fighting to stem the Rupee’s depreciation, foreign exchange reserves have been depleting since April and stand at their lowest since November 2017 at $399b. Lately, more pressure has been placed on the RBI to keep IDR stable. Finance Minister Arun Jaitely announced measures to help support the Rupee including limiting ‘non-essential imports’ and curbing oversea borrowing.
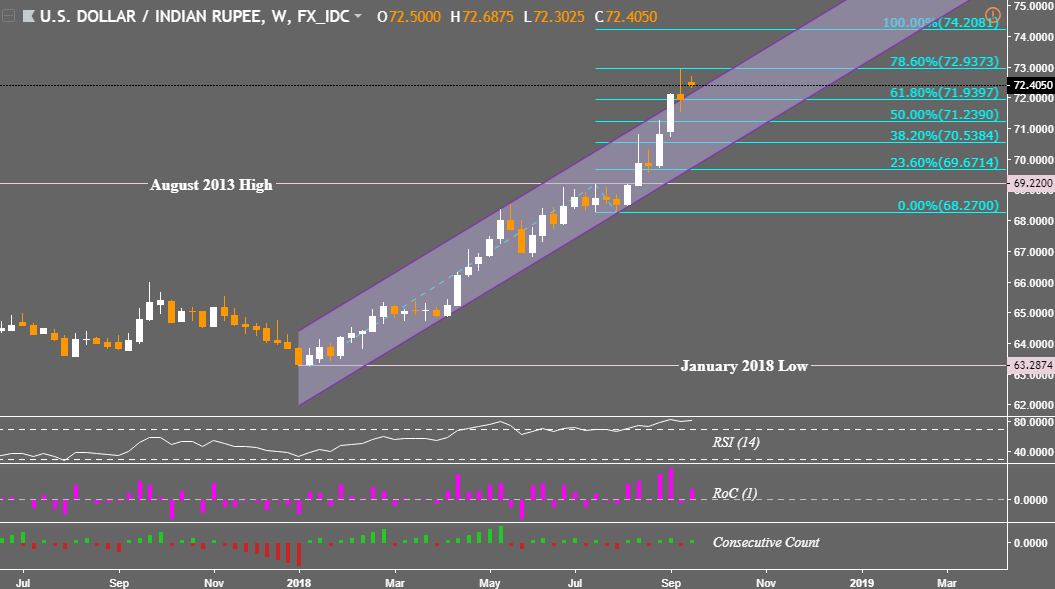
But the markets interpreted the efforts as rather underwhelming and USD/IDR rose further. As a result, overnight index swaps are now pricing in an RBI rate hike in October with about a 50% chance of a subsequent one in December. With that in mind, USD/IDR’s push above a rising channel could be overturned if the Reserve Bank of India takes enough of an aggressive policy stance to uphold their currency. This would put the focus on the 61.8% Fibonacci extension at 71.93 which could be near-term support.
USD/INR Weekly Chart
** All Charts Created in TradingView
FX Trading Resources
- Join a free Q&A webinar and have your trading questions answered
- Just getting started? See our beginners’ guide for FX traders
- Having trouble with your strategy? Here’s the #1 mistake that traders make
- See how the US Dollar is viewed by the trading community at the DailyFX Sentiment Page
--- Written by Daniel Dubrovsky, Junior Currency Analyst for DailyFX.com
To contact Daniel, use the comments section below or @ddubrovskyFX on Twitter