

US STOCKS OUTLOOK:
- S&P 500 and Nasdaq 100 decline for the second day in a row on fragile market sentiment
- Traders appear to avoid taking large directional positions ahead of a key economic report that could influence the Fed’s monetary policy outlook
- July’s U.S. inflation data due for release Wednesday will set the tone on Wall Street in the coming days
Trade Smarter - Sign up for the DailyFX Newsletter
Receive timely and compelling market commentary from the DailyFX team
Most Read: S&P 500, Nasdaq 100, Dow Technical Outlook for the Days Ahead
U.S. stocks were subdued on Tuesday on jittery sentiment amid heightened uncertainty about the economy in the face of slowing activity and sky-high inflation. At the closing bell, the S&P 500 slipped 0.42% to 4,122, losing ground for the second day in a row, with consumer discretionary and information technology leading the retreat among the major sectors. Elsewhere, the Nasdaq 100 slumped 1.15% to 13,008 as Tesla and Nvidia, two companies with large weightings in the tech index, suffered heavy losses on fears that their earnings could worsen going forward.
Aside from Wall Street's cautious tone, many traders opted to remain on the sidelines ahead of key economic data that could either bolster the mood or kill the recent equity market rebound in its tracks: the latest inflation report.
The U.S. Bureau of Labor Statistics will release the July Consumer Price Index on Wednesday morning. Headline CPI is expected to advance at 0.2% month-over-month after having risen 1.3% in June. With this result, annual inflation is seen easing to 8.7% from 9.1% previously, a slow but welcome directional improvement.
For stocks to resume the vigorous recovery seen late last month, inflationary forces must show convincing signs of moderation, as this is the only way for the Fed to adopt a less hawkish stance later this year or in 2023. This means the lower the CPI print tomorrow, the better for risky assets. On the other hand, if data surprises to the upside, as has happened numerous times in 2022, equities could sell-off violently as traders begin to price in a steeper path of interest rate hikes.

NASDAQ 100 TECHNICAL ANALYSIS
The Nasdaq 100 rallied strongly in recent weeks, but it has now begun to pull back after failing to clear channel resistance in the 13,350 area. While the recovery bias has not been nullified yet, the situation could change if sellers manage to push the index below the psychological 13,000 mark in the coming days. If this bearish scenario plays out, we could potentially see a move towards 12,600, followed by a retest of the 12,250 floor near the 50-day simple moving average.
On the flip side, if buyers resurface and push the index higher, initial resistance appears at 13,350. If prices breach this ceiling decisively, bullish momentum could accelerate, paving the way for an advance towards 13,550.
NASDAQ 100 TECHNICAL CHART
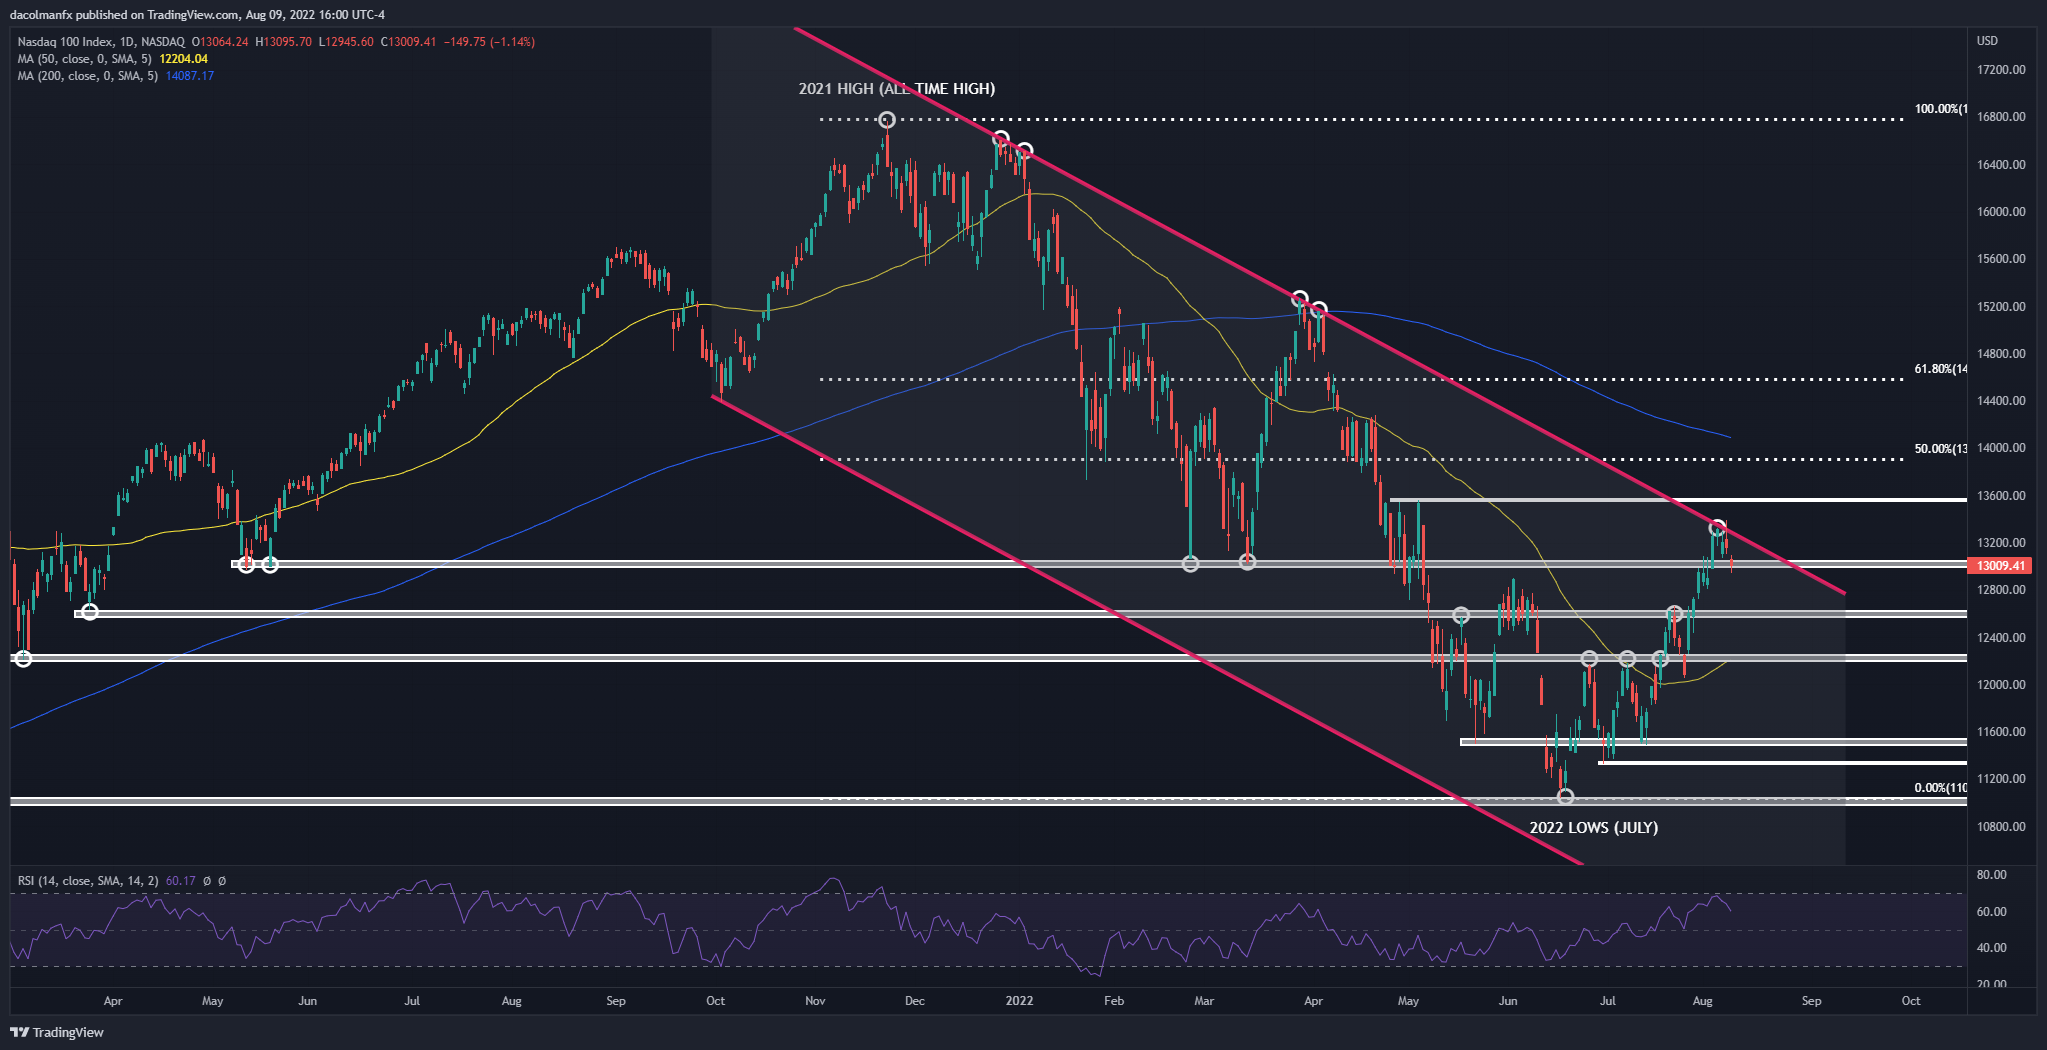
NASDAQ 100 Chart Prepared Using TradingView
EDUCATION TOOLS FOR TRADERS
- Are you just getting started? Download the beginners’ guide for FX traders
- Would you like to know more about your trading personality? Take the DailyFX quiz and find out
- IG's client positioning data provides valuable information on market sentiment. Get your free guide on how to use this powerful trading indicator here.
---Written by Diego Colman, Market Strategist for DailyFX