


Asia Pacific Market Open – S&P 500, US Dollar, Fed, Asia Stocks, China Manufacturing PMI
- US Dollar declined as the markets priced out even one Fed rate hike in 2019, S&P 500 swung
- Low liquidity amidst holiday trade still creates recipe for volatile price action as week begins
- Asia stocks may trade mixed unless China Manufacturing PMI contraction triggers a selloff
Find out what retail traders’ equities buy and sell decisions say about the coming price trend!
The US Dollar slid against most of its major counterparts on Friday as the markets priced out even just one Fed rate hike in 2019. With that said, stocks still ended the day mixed given low liquidity in holiday trade and with New Year’s still yet to come. The S&P 500 ended the day about 0.12% lower after a mixed session. That marked its only positive week in December given a rocky month for global benchmark stock indexes.
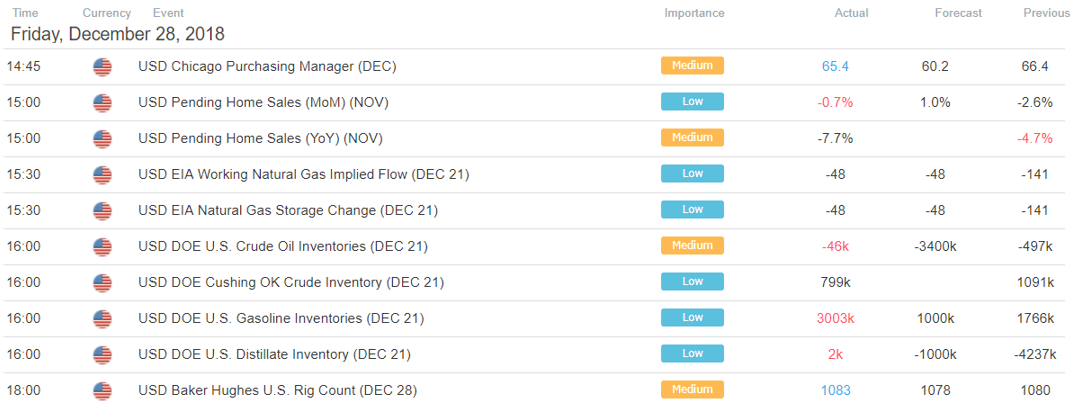
With that said, Wall Street was unable to follow-through after broad gains in European shares after traders seemed to have unwound their shorts. Investors remained jittery given a prolonged US government shutdown and recent dismal domestic consumer confidence. To add to that, pending home sales slid 7.7% y/y in November which was the largest contraction since April 2014.
The Canadian Dollar ended worse, sliding with local government bond yields which reflected fading 2019 BoC rate hike bets. Meanwhile the anti-risk Japanese Yen and Swiss Franc gained against their major counterparts. Amidst falling US government bond yields and the decline in the greenback, gold prices gained as the anti-fiat commodity.
Given the incoming New Year’s holiday and the reduction in liquidity, Asia Pacific markets may trade mixed. As for economic data, we will get December’s Chinese Manufacturing PMI which is on the verge of contraction. Local economic news flow has been tending to underperform, opening the door to an unexpected downside surprise. That may lead to aggressive risk aversion if it fuels more concerns about slowing Chinese economic growth.
NZD/USD Technical Analysis
The New Zealand Dollar sits right in a horizontal range of support between 0.66898 and 0.67141 which are the lows seen from July 2018. I am still holding short NZD/USD and resumption of risk aversion may lead to close under this area. That would open the door to perhaps reaching the 2018 low around 0.64247. You may follow me on twitter @ddubrovkyFX for updates to my setup.
NZD/USD Daily Chart
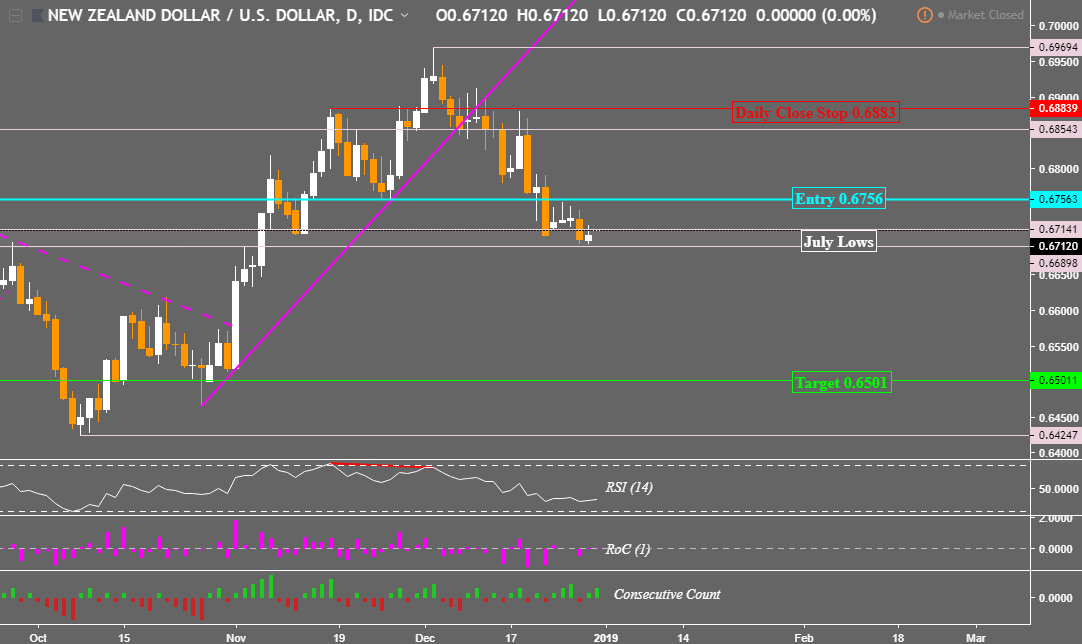
Chart created in TradingView
US Trading Session
Asia Pacific Trading Session

** All times listed in GMT. See the full economic calendar here
FX Trading Resources
- See how equities are viewed by the trading community at the DailyFX Sentiment Page
- Join a free Q&A webinar and have your trading questions answered
- See our free guide to learn what are the long-term forces driving US Dollar prices
- See our study on the history of trade wars to learn how it might influence financial markets!
--- Written by Daniel Dubrovsky, Junior Currency Analyst for DailyFX.com
To contact Daniel, use the comments section below or @ddubrovskyFX on Twitter


