


S&P 500, NIKKEI 225, ASX 200 WEEKLY OUTLOOK:
- Dow Jones, S&P 500 and Nasdaq 100 indexes closed +0.65%, +0.52% and +1.06% respectively
- Jackson Hole symposium will be in focus this week, with traders eyeing Fed tapering
- Asia-Pacific futures are pointing to a positive start of the week
Foundational Trading Knowledge
Understanding the Stock Market
Recommended by Margaret Yang, CFA
Wall Street Rally, Jackson Hole, US Dollar - Asia-Pacific Week-Ahead:
The S&P 500 index rebounded on Friday as investors took the recent selloff on Wall Street as an opportunity to accumulate more. Equity traders will be eyeing this week’s Jackson Hole symposium for clues about the Fed’s next move. The latest FOMC meeting minutes signaled that a majority of Fed members support an idea to scale back the $120 billion per month asset purchasing by the end of this year. Fed Chair Jerome Powell’s speech on Friday may strengthen this prospect, albeit the recent economic data showed signs of a slowing recovery.
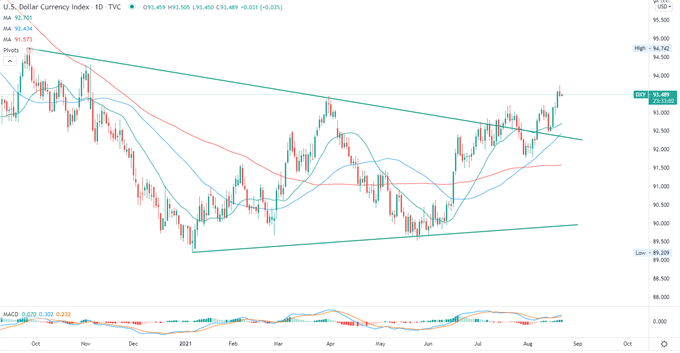
Against this backdrop, the DXY US Dollar index breached above a “Wedge” pattern it traded within for the last 12 months (chart below). This suggests that market has started to price in tapering stimulus and perhaps rate hikes in the longer horizon. A stronger US Dollar may exert downward pressure on commodity prices and weigh on emerging market assets.
DXY US Dollar Index
APAC markets look set to kick off the week on the front foot. Futures were higher in Japan, Hong Kong, Australia, Taiwan, Singapore, India and Thailand. Those in mainland China and South Korea are in the red however.
Japan’s Nikkei 225 index has lost over 11% since February as the country struggles to fight against the spread of the highly contagious Delta variant of Covid-19. There seems to be further downside risk amid concerns over whether the global economic recovery from the pandemic has already peaked.
For the week ahead, US durable goods orders and core PCE inflation data dominate the economic docket this week alongside the Jackson Hole symposium. Find out more from the DailyFX calendar.
Looking back to Friday’s close, all 11 S&P 500 sectors ended higher, with 81.8% of the index’s constituents closing in the green. Information technology (+1.3%), utilities (+1.22%) and communication services (+0.96%) were among the best performers, whereas consumer staples (+0.18%) and industrials (+0.24%) trailed behind.
S&P 500 Sector Performance 20-08-2021
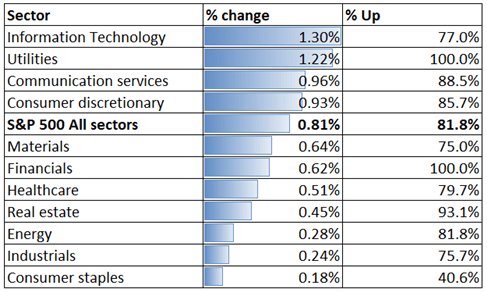
Source: Bloomberg, DailyFX
S&P 500 Index Technical Analysis
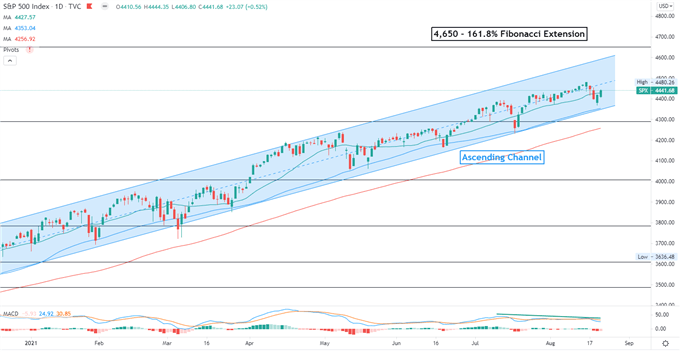
The S&P 500 index extended higher to challenge all-time highs. The overall bullish trend remains intact as suggested by the “Ascending Channel”. The next resistance level can be found at 4,650 – the 161.8% Fibonacci extension. A pullback may lead to a test of the 20- and 50-day SMA lines for immediate support.
S&P 500 Index – Daily Chart
Hang Seng Index Technical Analysis:
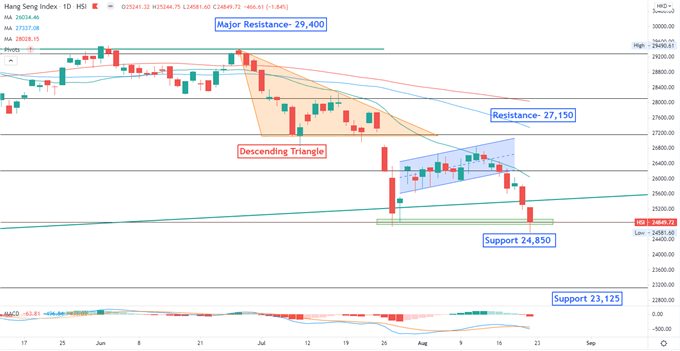
The Hang Seng Index (HSI) breached below the floor of an “Ascending Channel”, as highlighted in the chart below, hinting at further losses. Prices are testing an immediate support level at 24,850. Holding above this level may pave the way for a technical rebound. The MACD indicator remains below the neutral midpoint, underscoring bearish momentum.
Hang Seng Index – Daily Chart
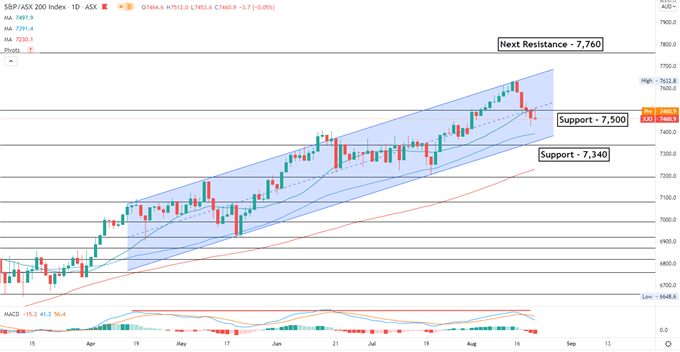
ASX 200 Index Technical Analysis:
The ASX 200 index pulled back sharply to test an immediate support level at 7,500 – the previous resistance. The overall trend remains bullish-biased, as suggested by the consecutive higher highs and higher lows formed over the past few months. The MACD indicator formed a bearish crossover after hitting trendline resistance, suggesting that selling pressure may be prevailing.
ASX 200 Index – Daily Chart

--- Written by Margaret Yang, Strategist for DailyFX.com
To contact Margaret, use the Comments section below or @margaretyjy on Twitter


