


CRUDE OIL & GOLD TALKING POINTS:
- Crude oil prices inch closer to seven-month rising trend support
- EIA inventory flow statistics may furnish sellers with a catalyst
- Gold prices may resume descent on upbeat services ISM report
Broad-based risk aversion weighed on sentiment-sensitive crude oil prices Wednesday, with the WTI contract following the bellwether S&P 500 downward. Technology shares led the way lower amid concerns that Congress may opt to begin regulating social media. API inventory flow data compounded downside pressure, showing inventories shed a relatively modest 1.17 million barrels last week.
Meanwhile, gold prices corrected higher as the US Dollar pulled back after four days of consecutive gains. The drop echoed a rise in European currencies led the by the British Pound amid reports of a Brexit negotiations breakthrough between the UK and Germany. The greenback’s decline offered a familiar lift to anti-fiat alternatives epitomized by the yellow metal.
SERVICE-SECTOR ISM, EIA INVENTORIES DATA IN FOCUS
From here, EIA inventory flow data is in focus for crude oil prices. Economists expect a draw of 2.38 million barrels. An outcome closer to the API projection may see recent losses compounded. Meanwhile, an uptick in the service-sector ISM gauge may reenergize Fed rate hike speculation and send the US Dollar higher anew, renewing selling pressure on gold prices.
See our guide to learn about the long-term forces driving crude oil prices !
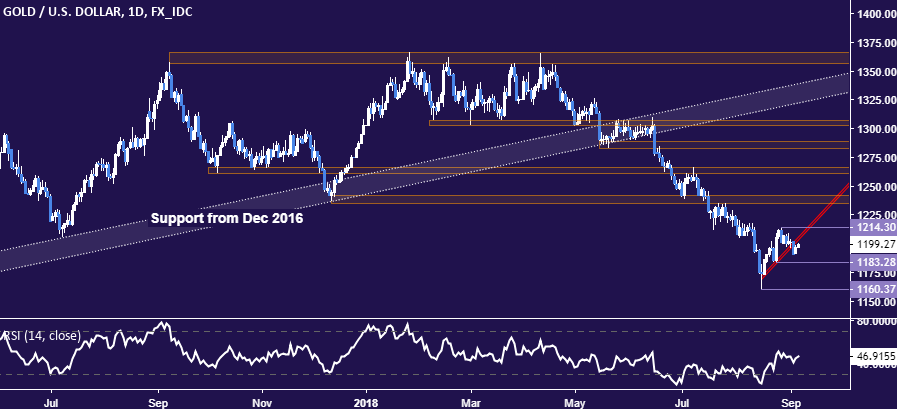
GOLD TECHNICAL ANALYSIS
Gold prices corrected higher but the break of counter-trend support signaling down trend resumption remains intact. From here, a daily close below theAugust 24 lowat 1183.28 exposes the swing bottom at 1160.37. Alternatively, a reversal back above the August 28 high at 1214.30 opens the door for a retest of the 1235.24-41.64 area.
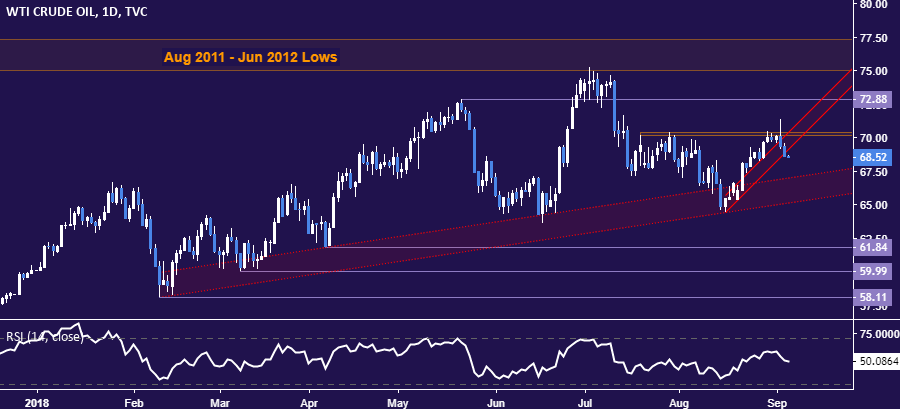
CRUDE OIL TECHNICAL ANALYSIS
Crude oil prices are pressuring support guiding the upswing from mid-August lows. A break confirmed on a daily closing basis paves the way for a challenge of dominant rising trend support in the 65.18-67.07 area. Alternatively, a push above resistance in the 70.15-41 zone targets the inflection point at 72.88.
COMMODITY TRADING RESOURCES)
- Learn what other traders’ gold buy/sell decisions say about the price trend
- Having trouble with your strategy? Here’s the #1 mistake that traders make
- Join a Trading Q&A webinar to answer your commodity market questions
--- Written by Ilya Spivak, Currency Strategist for DailyFX.com
To contact Ilya, use the comments section below or @IlyaSpivak on Twitter


