


GOLD & CRUDE OIL TALKING POINTS:
- Gold prices fall with stocks as Covid case growth spooks the markets
- Break of near-term chart support hints gold may drop below $1750/oz
- Crude oil prices might be forming a double top below $44/bbl figure
Gold prices retreated as worries alongside stocks and other sentiment-driven assets as worries about a pickup in Covid-19 cases weighed on financial markets. The risk-off backdrop triggered a familiar drop in Treasury bond yields, but whatever support might have been had there was overwhelmed as haven demand buoyed the US Dollar. That undermined the appeal of anti-fiat alternatives epitomized by the yellow metal.
Cyclically-geared crude oil prices acted true to type and fell. EIA data showing US inventories added 1.44 million barrels last week probably did not help matters. That was a larger rise than the 1.14-million-barrel build projected by analysts. The overall stockpile (excluding the Strategic Petroleum Reserve) is now at its largest since at least 1982, speaking to the slump in global demand amid the Covid-19 outbreak.
More of the same looks likely ahead as bellwether S&P 500 stock index futures succumb to convincing selling pressure in late Asia-Pacific trade. The Fed will release annual stress test resultsfor major US banks. The general consensus envisions resilience following the reforms in the wake of the 2008 global financial crisis. Outcomes calling this view into question may aggravate the risk-off mood.

GOLD TECHNICAL ANALYSIS
Gold prices broke near-term support (on the 4-hour chart) after forming a Bearish Engulfing candlestick pattern. Sellers may now move to challenge the 1744.58-45.59 area, with a break below that doubling as a breach of trend line support from early June. The congestion region top at 1729.86 – now recast as support – follows thereafter. Alternatively, a push back above 1765.30 eyes the swing top at 1779.38 next.
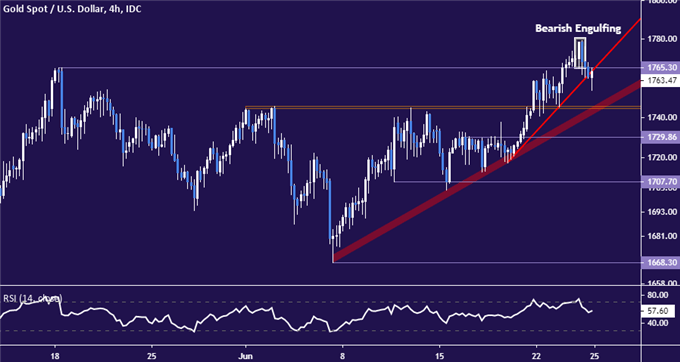
Gold price chart created using TradingView
CRUDE OIL TECHNICAL ANALYSIS
Crude oil prices are struggling below resistance in the 42.40-43.88 area, a barrier anchored by former support at the December 2018 bottom.Negative RSI divergence speaks to fading upside momentum, warning that a double top may be forming. Confirmation on a daily close below support at 34.78 likely exposes the 27.40-29.11 inflection zone. Alternatively, a breach of resistance may take aim at $50/bbl next.
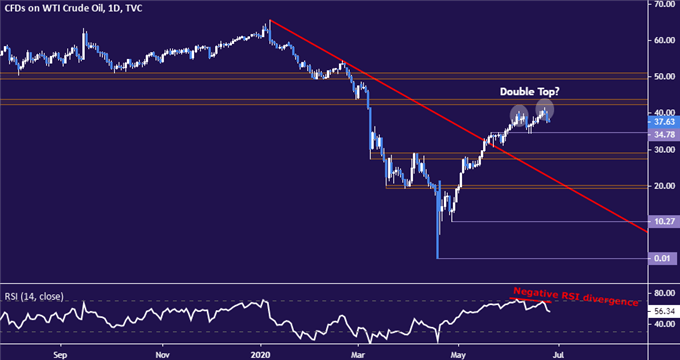
Crude oil price chart created using TradingView
COMMODITY TRADING RESOURCES
- See our free guide on the drivers of crude oil price trends
- What is your trading personality? Take our quiz to find out
- Join a free live webinar and have your questions answered
--- Written by Ilya Spivak, Head APAC Strategist for DailyFX
To contact Ilya, use the comments section below or @IlyaSpivak on Twitter


