


Gold, XAU/USD, Inflation, Real Yields, producer prices - Talking Points
- Gold gains as CPI data hints that inflation may have peaked
- US producer price index (PPI) may sway bullion prices further
- XAU climbs above January high, potentially fueling further gains

Gold prices staged a rebound overnight after inflation cooled slightly in the United States, according to the latest consumer price index (CPI) for April. The CPI crossed the wires at 8.3% on a year-over-year basis. That was higher than the 8.1% Bloomberg consensus estimate. However, it was slightly lower from March’s 8.5% y/y figure.
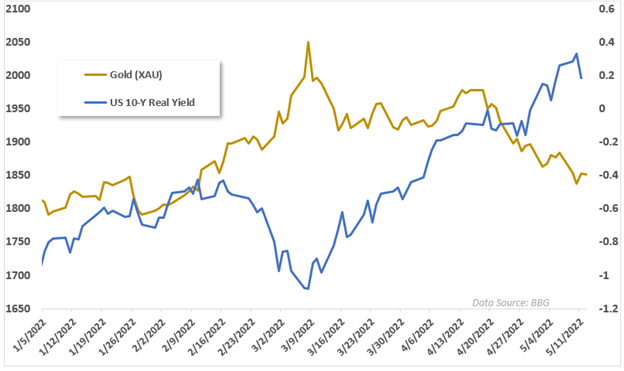
The reaction in gold was likely due to the Treasury market’s behavior. Real yields – a major driver for bullion prices, fell following the CPI print. Lower real yields benefit gold because it is a non-interest-bearing asset, which lowers the opportunity cost of gold. The 10-year inflation-indexed rate fell 15-basis points overnight but remain in positive territory. The yellow metal may continue to gain if real yields drop further.
Tonight will bring the US’s producer price index (PPI) data for April. Analysts see PPI cooling to 0.5% on a month-over-month basis, according to a Bloomberg survey. That would be down from 1.4%, representing a rather significant drawdown. That may help to calm inflationary fears, as factory-gate prices are sometimes seen as a leading indicator for downstream inflation. Gold may move higher if tonight’s data comes in below expectations.
XAU/USD Technical Forecast
Gold prices are moving above the January swing high through Asia-Pacific trading, a level that has previously provided support. Holding that level may ignite further bullish energy to drive prices higher. If so, the falling 20-day Simple Moving Average (SMA) may cap upside. Meanwhile, MACD and the RSI oscillators appear to be improving.
XAU/USD Daily Chart
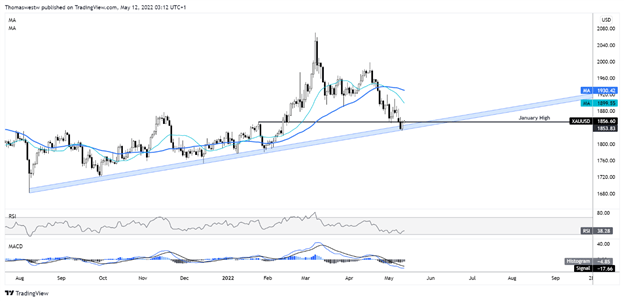
Chart created with TradingView
Trade Smarter - Sign up for the DailyFX Newsletter
Receive timely and compelling market commentary from the DailyFX team
--- Written by Thomas Westwater, Analyst for DailyFX.com
To contact Thomas, use the comments section below or @FxWestwater on Twitter


