


US Dollar Talking Points:
- This morning brought the release of September Non-Farm Payrolls numbers out of the United States, and the headline number was not strong as we saw a print of +134k v/s an expectation of +185k. The internals of the report were a bit better, however, as the unemployment rate came-in at a near 50-year-low of 3.7% versus the 3.8% expectation – and the highly-watched area of Average Hourly Earnings printed in-line at .3% for the month or 2.8% annualized.
- The US Dollar’s reaction was very interesting, as an initial dip was quickly bought and prices pushed higher for the first ten minutes of the release. But a quick reversal soon developed, and this drove prices below their pre-NFP open price to create the net of a bearish move around this morning’s data. Next week’s economic calendar is very quiet – and this could be an opportune time for prevailing trends to avail themselves as markets won’t have nearly as many distractions or noise as produced by data releases and economic calendar events.
- DailyFX Forecasts on a variety of currencies such as the US Dollar or the Euro are available from the DailyFX Trading Guides page. If you’re looking to improve your trading approach, check out Traits of Successful Traders. And if you’re looking for an introductory primer to the Forex market, check out our New to FX Guide.
Do you want to see how retail traders are currently trading the US Dollar? Check out our IG Client Sentiment Indicator.
NFP Disappoints on the Headline Number; Average Hourly Earnings Prints In-Line
The expectation for this morning’s release of September Non-Farm Payroll numbers was for +185k jobs to have been added to American payrolls in the recently completed month. The actual print came-in quite a bit below that level to print at +134k, making for a fairly large miss on the headline number. The internals within the report weren’t all that bad, however, as the unemployment rate came in below expectations at 3.7% vs 3.8%, and Average Hourly Earnings hit the expectation on the nose for a .3% monthly gain (2.8% annualized).
The net response in the US Dollar was an initial move of weakness to test below the 95.75 potential support area we looked at in yesterday’s webinar. That dip did not last for long, as buyers quickly pounced to push prices up to a fresh daily high. But even that was soon faded out as sellers responded ten minutes after the release to push prices below their pre-NFP levels.
US Dollar One-Minute Price Chart After NFP Release
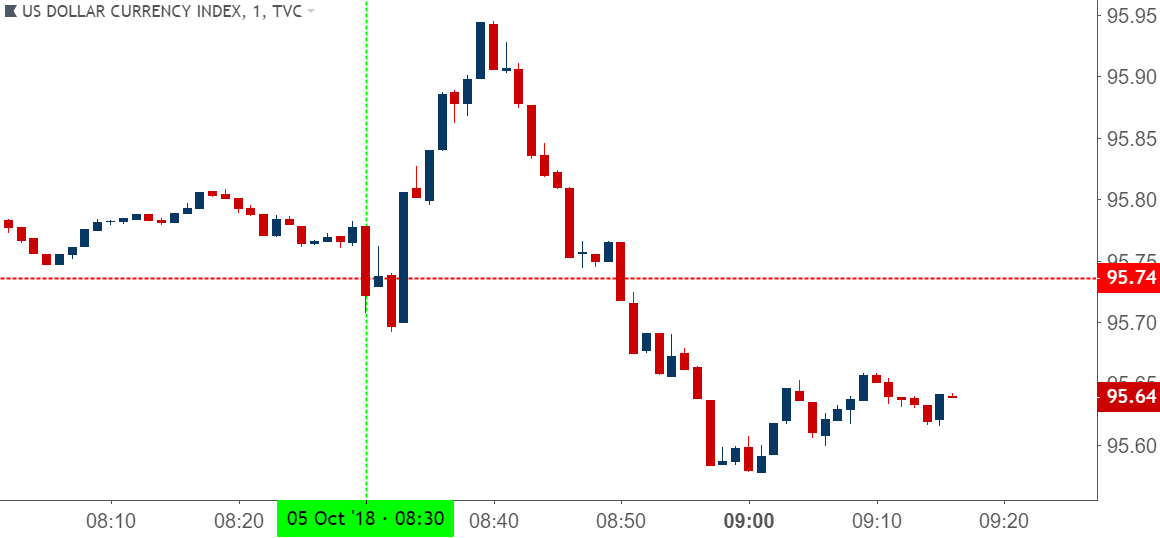
Chart prepared by James Stanley
It’s with prints like this in which trends show their hands; as a disappointing headline print helped to bring buyers into the fray after a quick test below support. But sellers were sitting on the sidelines waiting for a bounce in order to pounce, and this has helped to produce that net response of weakness despite a couple of different directional swings after the release.
The big question as we trade deeper into Q4 is whether this bigger-picture theme of USD strength can continue. It’s a rather new scenario and this is something that didn’t really become prominent until a week ago. But, as we discussed yesterday, that strength has been rather pronounced and given the veracity with which this theme has been pushed, the prospect of further gains remains as we trade towards the end of this year.
US Dollar Daily Price Chart: USD Retreats After Pronounced Week-Long Run

Chart prepared by James Stanley
On that topic of evaluating trends, next week could be a great opportunity to do so as we have a relatively quiet economic calendar. The big item of interest will likely be the Thursday release of September inflation numbers out of the United States but, outside of that, there isn’t much for high-impact releases on next week’s economic docket.
This can provide a fertile backdrop for prevailing trends to avail themselves without the distraction or noise of near-term data. This could also put the spotlight on some of the existential themes that have shown of recent, speaking to Italian politics and its impact on the Euro, as well as the still-developing saga of Brexit negotiations.
DailyFX Economic Calendar: A Quieter Week Ahead
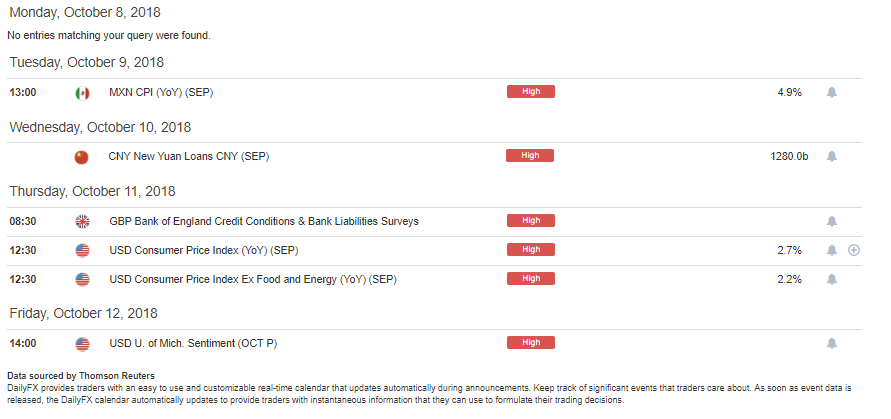
Chart prepared by James Stanley
EUR/USD Re-Tests 1.1530 Resistance at Prior Support
Key to that directional move in the US Dollar will likely be the course taken by the Euro and, more to the point, EUR/USD. It’s the flash of weakness over the past week, as driven by fears around Italian politics, that have really appeared to drive these themes of Euro weakness and US Dollar strength. And this isn’t a new observation, as this is what had helped to drive those trends with such prominence in late-April and early-May.
For much of the summer, EUR/USD found support at the level of 1.1530, only succumbing to selling pressure in early-August when fears around Turkey were flying high. But, after prices recovered, 1.1530 was back as support, and Wednesday’s breakdown saw this level come back into play. As we wrote yesterday, there was resistance potential at that prior area of support, and that had held into this morning’s NFP release. With USD now pulling back, EUR/USD is re-testing this resistance at a key area of prior support.
EUR/USD Four-Hour Price Chart: Resistance at Prior Support of 1.1530
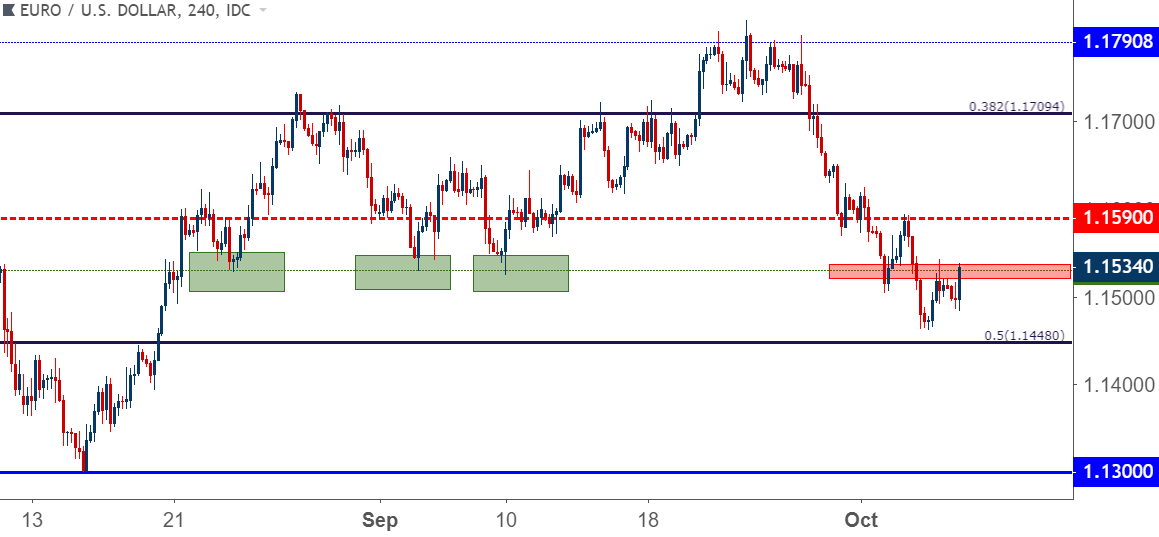
Chart prepared by James Stanley
The big question around the pair as we trade into next week is whether the drive of weakness will remain, and that will likely be determined by dynamics in Italian politics and whether we get closer to a debt stand-off with the ECB. A big level to watch given current technical is the 1.1590 area on the chart. This was the Wednesday swing high on the pair, and the setting of resistance there led to a fairly one-sided run that led to a temporary test below 1.1500.
That psychological level at 1.1500 is proving to be a tough level to break, as this week has already seen two failed attempts from sellers to leave it behind. But – if we see continued development of the fear around Italian politics, we will likely be looking at further tests below until, eventually, buyers can hold up the line no longer.
EUR/USD Hourly Price Chart: Sellers Unable to Leave 1.1500 Behind For Now
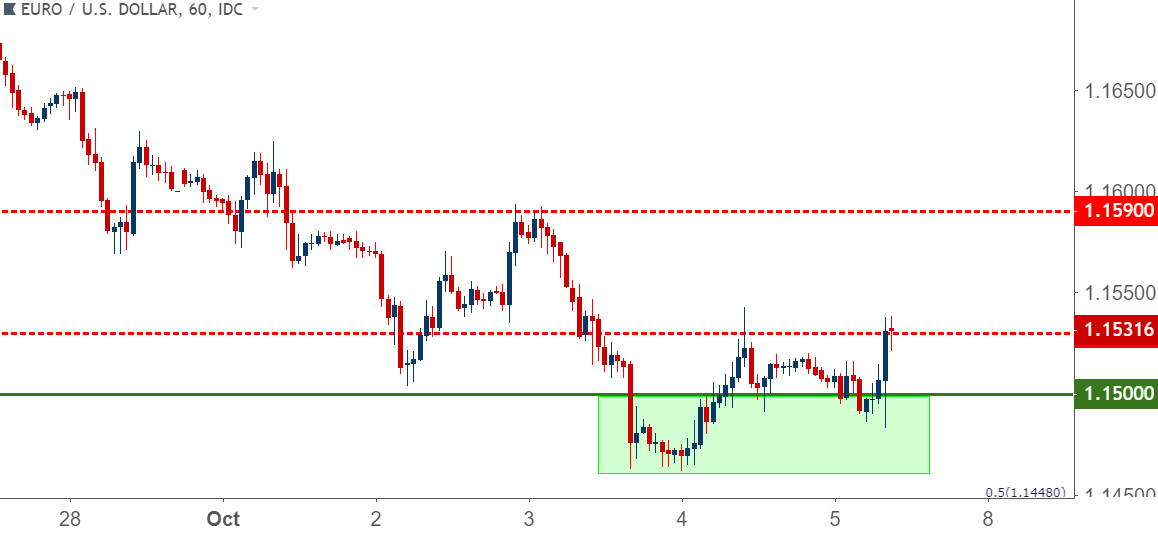
Chart prepared by James Stanley
Cable Bulls Come Back
While intense focus has been paid to the developing situation in the Euro-Zone, Cable bulls have made a fairly clear push over the past two days after finding support in a key area on the chart. The support zone that we’ve been following that runs from 1.2918-1.2956 helped to arrest the declines in the pair on Wednesday of this week, and since then we’ve seen a concerted response from buyers to drive prices back towards 1.3100.
The big question at this point is whether we see a re-test of the key Fibonacci level at 1.3117, and if so, the door could soon be re-opened to higher-low support in plays of bullish continuation.
This could work as a type of counter-balance around the US Dollar for those looking at long-USD strategies against the Euro.
GBP/USD Four-Hour Price Chart: Cable Bulls Pounce After Test of Key Support

Chart prepared by James Stanley
To read more:
Are you looking for longer-term analysis on the U.S. Dollar? Our DailyFX Forecasts for Q3 have a section for each major currency, and we also offer a plethora of resources on USD-pairs such as EUR/USD, GBP/USD, USD/JPY, AUD/USD. Traders can also stay up with near-term positioning via our IG Client Sentiment Indicator.
Forex Trading Resources
DailyFX offers a plethora of tools, indicators and resources to help traders. For those looking for trading ideas, our IG Client Sentiment shows the positioning of retail traders with actual live trades and positions. Our trading guides bring our DailyFX Quarterly Forecasts and our Top Trading Opportunities; and our real-time news feed has intra-day interactions from the DailyFX team. And if you’re looking for real-time analysis, our DailyFX Webinars offer numerous sessions each week in which you can see how and why we’re looking at what we’re looking at.
If you’re looking for educational information, our New to FX guide is there to help new(er) traders while our Traits of Successful Traders research is built to help sharpen the skill set by focusing on risk and trade management.
--- Written by James Stanley, Strategist for DailyFX.com
Contact and follow James on Twitter: @JStanleyFX


