


GOLD FUNDAMENTAL HIGHLIGHTS:
- Gold Uninspiring as Familiar Resistance Caps
- US Dollar Chops, US Rates Pop, Gold Vulnerable to a Drop
Gold Uninspiring as Familiar Resistance Caps
The precious metal had a somewhat uninspiring week, with initial gains faded throughout the back end of the week. Once again, upside in gold has been capped at 1860, this time the 50-200DMA holding firm. The 1840-60 area has been a tough area for gold to break in recent weeks, while an RSI that has remained below 50 also provides little indication that the top of the area will be breached in the near term. On the downside, support is situated at 1809 (Jan 18th low) with 1784 below (Feb low), which protects the November low 1764.
Gold Chart: Daily Time Frame

Source: Refinitiv

US Dollar Chops, US Rates Pop, Gold Vulnerable to a Drop
It is also important to keep track at what the USD is doing, which has also traded in rather choppy fashion, hence explaining part of muted trade in gold. With that in mind, FX implied vols continue to hover at recent lows, suggesting that sideways trading may persist a little longer for both the greenback and gold. I expect the market to get a tad more exciting should the USD drift lower and eventually breach the psychological 90 handle, which could start to see a market that renews its interest in the gold bull view. But for now, tepid price action does not bode well for the precious metal, particularly as US rates creep higher.
US Dollar Chart: Daily Time Frame
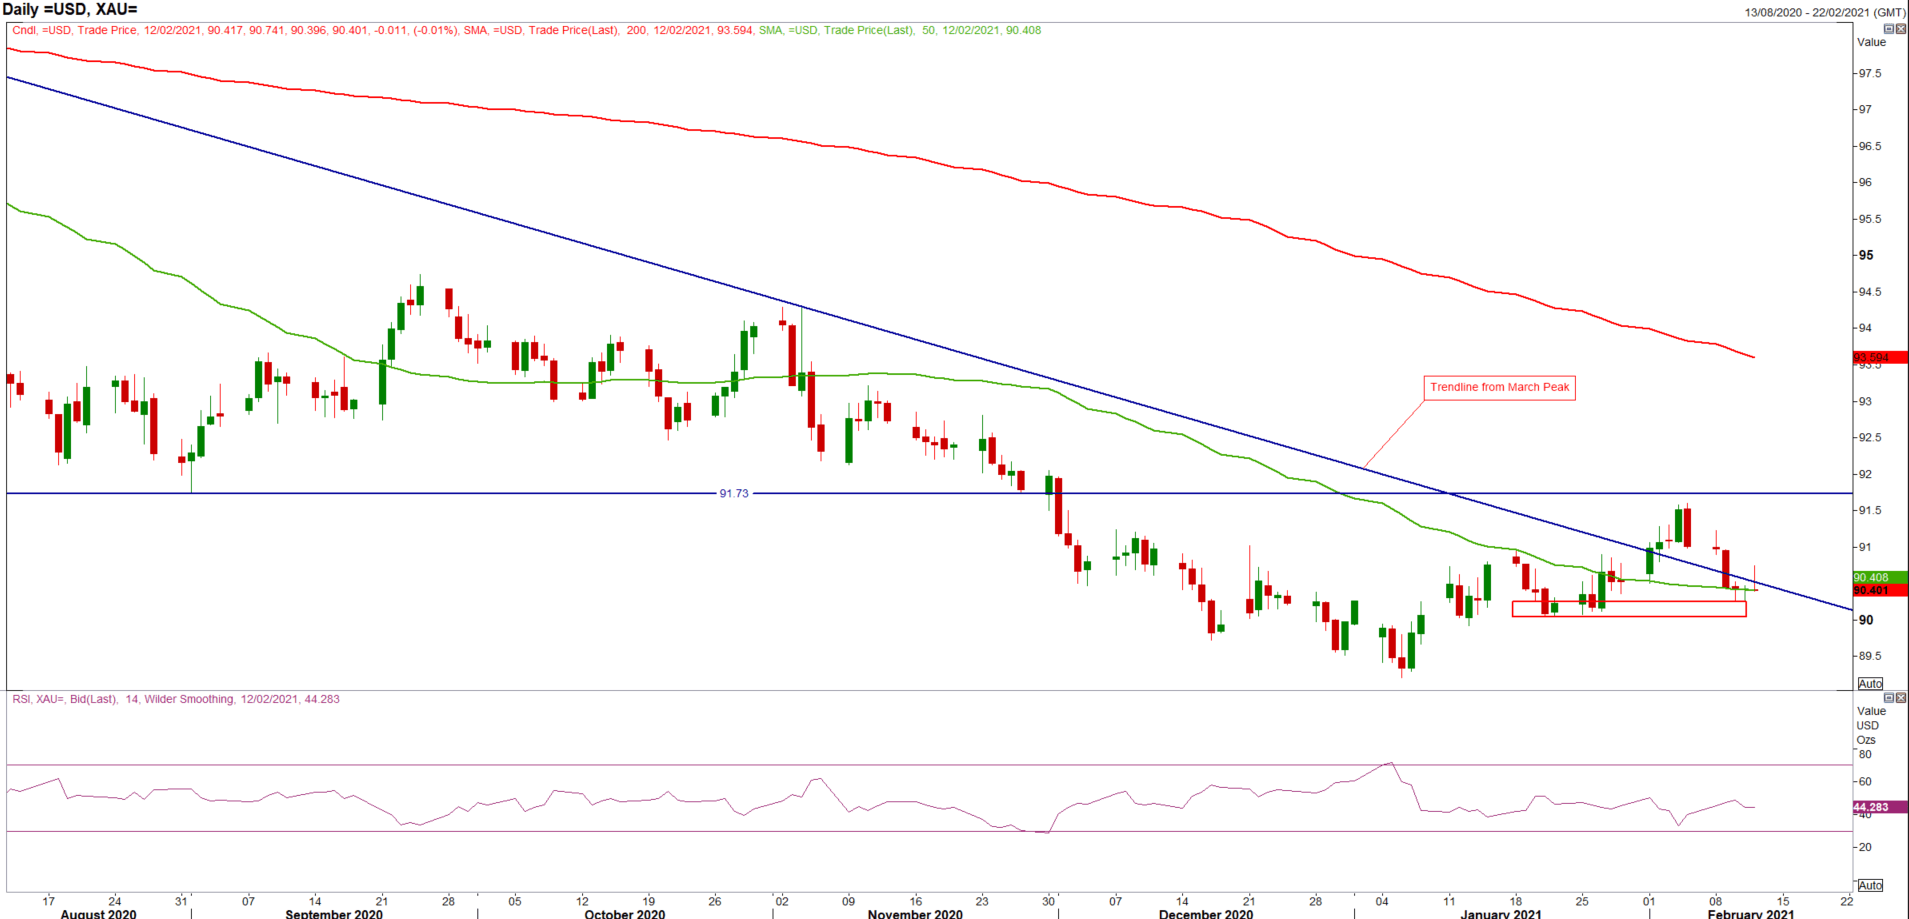
Source: Refinitiv
| Change in | Longs | Shorts | OI |
| Daily | -9% | 1% | -4% |
| Weekly | -12% | 18% | 1% |
Key US Data in Focus: NFP and ISM PMIs
Looking ahead to next week, central bank minutes from the ECB and FOMC will be in focus with the week finishing off with global PMI releases.


