


S&P 500, FTSE 100 Analysis and News

S&P 500 | All Eyes on Powell
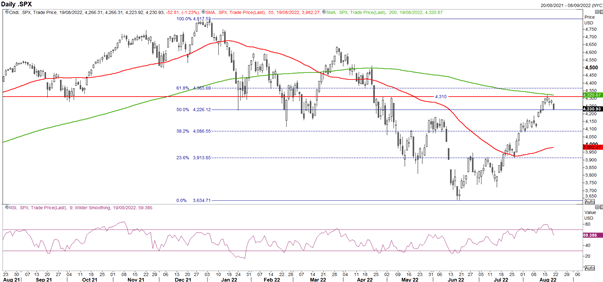
The S&P 500 is on course for its first weekly drop in a month, breaking a streak of four consecutive weekly gains. A softer Chinese economic outlook and a continued pushback from Fed Officials on the so-called Fed pivot has been a factor behind the renewed pullback. Alongside this, key technical barriers have played their part for bears to lean on. I continue to believe the rise since the June lows is a bear market rally, which would be reassessed should we see a close above the 55WMA (4354).
Next week, the key focus will be on Fed Chair Powell at the Jackson Hole Symposium, where he is expected to deliver a speech on the economic outlook at 1500BST on August 26th. As we have seen from various Fed Officials, the fight against inflation is far from over and while the recent FOMC minutes portrayed slight angst over economic growth, the recent NFP report will quell those fears. Therefore, a hawkish statement will likely renew equity downside into next month’s NFP report.
S&P 500 Chart: Daily Time Frame
| Change in | Longs | Shorts | OI |
| Daily | 2% | -1% | 0% |
| Weekly | -2% | 3% | 1% |
FTSE 100 | Range Top Hurdle
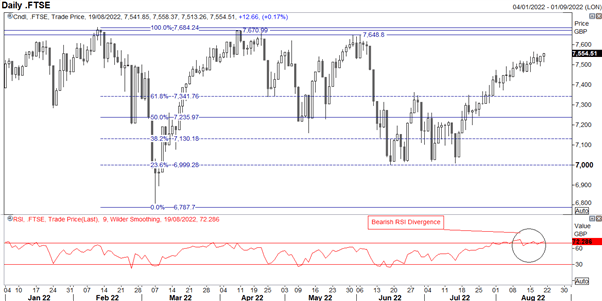
I am also keeping a very close eye on the FTSE 100. Unlike its counterparts, the index has essentially in a broad 6800-7600 range throughout the year. However, now that we are approaching the top of that range around 7600-50, this may be a good area to look for a pullback. One of the reasons is the fact that China slowdown risks are coming back to the forefront of investors' minds, keep in mind the FTSE 100 is much more exposed to China than its counterparts given that index heavyweights are within the commodity space.
A gauge of Chinese sentiment can be looked at through the lens of FX with the Chinese Yuan. As shown in the chart below, USD/CNH is testing its 2022 peak and thus a firm breakthrough is likely to prompt a fresh wave of risk-off sentiment and I would expect the FTSE 100 to come under pressure.
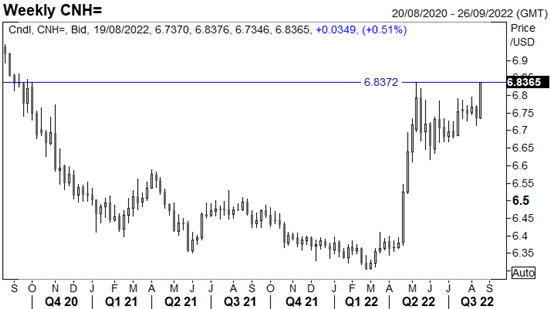
Source: Refinitiv
Now in this next chart, perhaps I might be committing a chart crime here, but here is an overlay of USD/CNH inverted vs the FTSE 100, which shows that USDCNH has tended to fall notably before the FTSE 100. Leading indicator or just a spurious correlation?
FTSE 100 vs USD/CNH Inverted
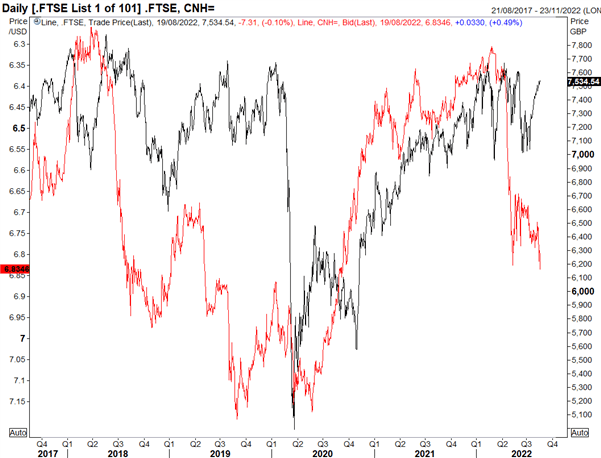
Source: Refinitiv
For those who are patient, the opportune moment could be to await a pullback from 7600-50. My view of looking for the FTSE 100 to drop would be wrong should we close above 7710.
FTSE 100 Chart: Daily Time Frame
Source: Refinitiv
| Change in | Longs | Shorts | OI |
| Daily | -10% | 13% | 3% |
| Weekly | -11% | 14% | 3% |
Whether you are a new or experienced trader, we have several resources available to help you; indicators for tracking trader sentiment, quarterly trading forecasts, analytical and educational webinars held daily, trading guides to help you improve trading performance, and one specifically for those who are new to forex.


