


Oil Price Talking Points
The price of oil climbs to a fresh weekly high ($51.73) despite a larger-than-expected rise in US crude inventories, and oil prices may attempt to break out of the monthly range as the Relative Strength Index (RSI) flashes a textbook buy signal.
Oil Forecast: RSI Offers Buy Signal Even as OPEC Cuts Demand Forecast
The price of oil approaches the monthly high ($52.20) even though US crude inventories increased for the third consecutive week, with stockpiles rising 7459K in the week ending February 7 versus forecasts for a 3200K expansion.
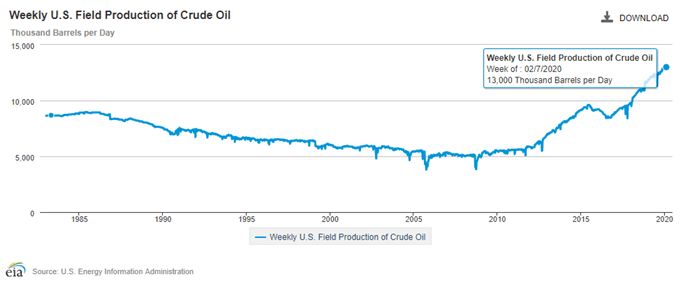
In addition, weekly field production bounced back during the same period, with crude output climbing to the record high of 13,000K from 12,900K in the week ending January 31, and signs of greater supply may become a growing concern for the Organization of the Petroleum Exporting Countries (OPEC) as the group reduces its oil demand forecast for 2020.
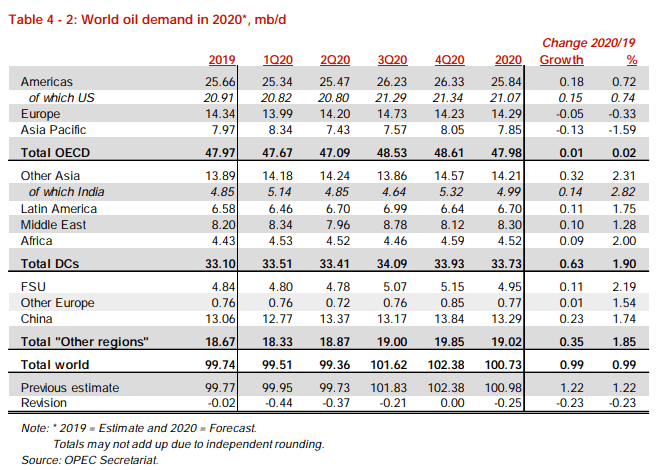
The most recent Monthly Oil Market Report (MOMR) notes that “oil demand growth in 2020 is revised down by 0.23 mb/d from the previous month’s assessment” as China, one of the largest consumers of oil, struggles to contain the coronavirus, and OPEC and its allies may take additional steps to rebalance the energy market as the Joint Technical Committee (JTC) “recommendedextending voluntary production adjustments under the ‘Declaration of Cooperation’ process until the end of 2020.”
In turn, OPEC and its allies may take additional steps to keep crude prices afloat, but it remains to be seen if the group will make a major announcement at the next meeting starting on March 5 as Gazprom Neft CEO Alexander Dyukov, one of the largest oil producers in Russia, proposes to “maintain current quotas.”
With that said, the ongoing commitment to the ‘Declaration of Cooperation’ may continue to provide a floor for crude prices, and the price of oil may attempt to break out of the monthly range as the Relative Strength Index (RSI) flashes a textbook buy signal.

Sign up and join DailyFX Currency Strategist David Song LIVE for an opportunity to discuss key themes and potential trade setups.
Crude Oil Daily Chart

Source: Trading View
- Crude appears to be stuck in the monthly opening range after clearing the August low ($50.52), and the price of oil may continue to consolidate amid the lack of momentum to break/close below the Fibonacci overlap around $48.80 (38.2% expansion) to $49.80 (78.6% retracement).
- However, the Relative Strength Index (RSI) instills a bullish outlook for crude as the oscillator breaks out of the downward trend from earlier this year and bounces back from oversold territory to flash a textbook buy signal.
- Need a break/close above the Fibonacci overlap around $51.40 (50% retracement) to $51.80 (50% expansion) to open up the $53.10 (23.6% retracement) region, with the next area of interest coming in around $54.90 (61.8% expansion) to $55.50 (38.2% retracement).

--- Written by David Song, Currency Strategist
Follow me on Twitter at @DavidJSong


