Brent Oil Technical Analysis, Prices and Chart
- Oil’s rebound from oversold conditions looks sustainable.
- Fibonacci retracement and moving averages block the upside.
Q4 Trading Forecasts including Oil.
Brent Crude Struggles to the Upside
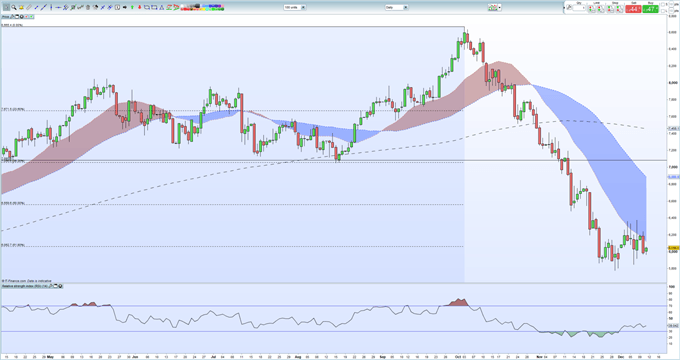
After last week’s OPEC+ rally which pushed Brent back up to $63.70/bbl. the spot price has drifted lower and now trades around $60.0/bbl. and is likely to remain around there in the short-term. A lack of any fresh drivers has taken the volatility out of oil and price action is expected to stay muted until 2019. While the OPEC+ decision to remove 1.2 million barrels a day was supportive of oil, the news that the US keeps pumping - it is now a net exporter of oil for the first time in 75 years – will keep a lid on the oil complex.
On the charts, the recent low print at $57.74/bbl. is expected to act as strong support to any sell-off, while on the upside the way forward is blocked by the 61.8% Fibonacci retracement level at $60.62/bbl. ahead of the 20-day moving average at $61.22/bbl. Above here the 50% Fibonacci retracement level at $65.59/bbl. should provide tough resistance in the short-term. A period of stable price movement – between $57.75/bbl. and $65.50/bbl. - may well be what oil traders need after its recent bear market sell-off.
WTI vs Brent – Top 5 Differences Between WTI and Brent Crude Oil
How to Trade Oil – Crude Oil Trading Strategies
Brent Crude Oil Daily Price Chart (April – December 11, 2018)

Retail traders are 85.7% net-long US Crude according to the latest IC Client Sentiment Data, a bearish contrarian indicator. However, recent changes in daily and weekly positions currently give us a stronger negative trading bias.
Traders may be interested in two of our trading guides – Traits of Successful Traders and Top Trading Lessons – while technical analysts are likely to be interested in our latest Elliott Wave Guide.
What is your view on Oil – bullish or bearish?? You can let us know via the form at the end of this piece or you can contact the author at nicholas.cawley@ig.com or via Twitter @nickcawley1.


