
STOCK MARKET RETURNS WHEN THE FED CUTS RATES – SUMMARY POINTS
- Stock market investors are largely expecting Chair Powell and the FOMC to cut rates this July for the first time since December 2008
- S&P 500 Index returns are mixed following the start of a Fed rate cut cycle, but recent history and current market dynamics paint a bleaker picture
- Download the free Q3 Equity Forecast for comprehensive fundamental and technical analysis on the major global stock market indices
Over the last few months, financial markets have observed a sharp shift in monetary policy outlook from the Federal Reserve (Fed). The US central bank pivoted quickly from a hawkish stance indicated by Chair Powell and FOMC members this past December who previously hinted at 3 rate hikes for 2019 to the current stance of no rate hikes this year. Meanwhile, rate traders are now pricing in a rough 75 basis points of cuts to the Fed’s policy interest rate by the end of 2019 which currently stands at 2.25-2.50 percent.
WILL THE FED CUT RATES IN 2019?
Several business cycle indicators – like the yield curve inversion – amid decelerating GDP growth suggests that the global economy is losing momentum quickly and suggest that the latest expansion may be on its last leg. Heightened market risks revolving tariffs and the lingering US-China trade war have also largely driven the stark change in interest rate expectations.
A drastic deterioration in economic data and ballooning market uncertainty has backed the Fed into a corner with little choice but to juice the slowing economy with monetary stimulus. Additionally, this is being hinted at by tepid inflation and fading strength in the US labor market. Now, with the central bank aiming to preserve its dual mandate of stable prices and employment, it appears more likely than not that the Fed will cut rates this year. This is also in consideration of recent commentary from Chair Powell at the June Fed meeting where the head central banker hinted at the FOMC’s willingness to act and ease monetary policy – if needed.
HOW DO STOCKS PERFORM WHEN THE FED CUTS RATES?
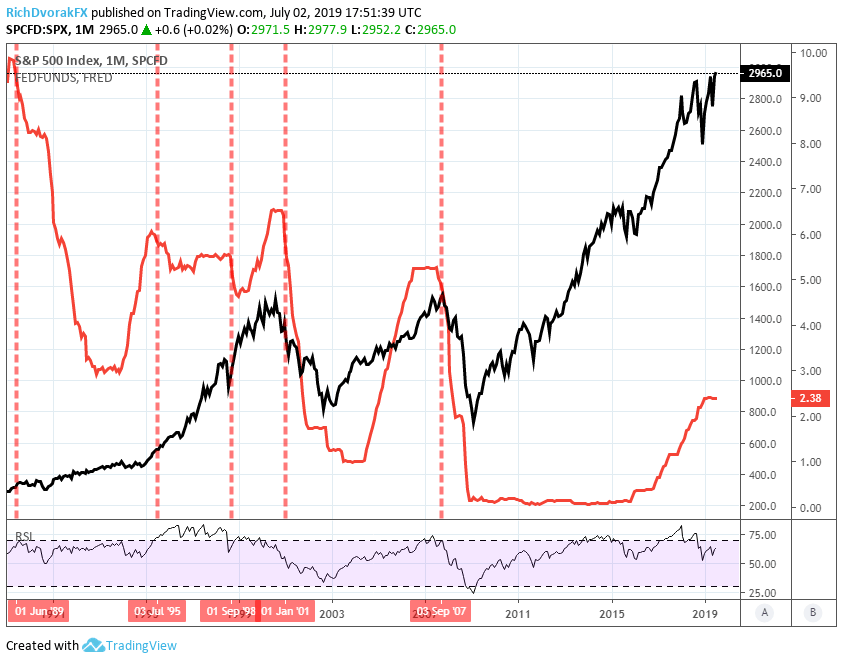
Historically speaking, stocks tend to benefit from lower interest rates set by the Federal Reserve. This was also pointed out by Goldman Sach’s equity strategist, David Kostin, who stated that “if the Fed does cut rates, the S&P 500 usually rallies afterward,” adding that “few precedents exist during the past 30 years where futures discounted an interest rate cut 30 days prior to a scheduled FOMC meeting but the Fed did not cut.” This relationship can be observed in chart 1 below which depicts the monthly change in the S&P 500 Index and the effective federal funds rate (FFR).
S&P 500 INDEX PRICE AND EFFECTIVE FEDERAL FUNDS RATE OVERLAY – CHART 1
S&P 500 INDEX RETURNS DURING START OF FED RATE CUT CYCLES – CHART 2
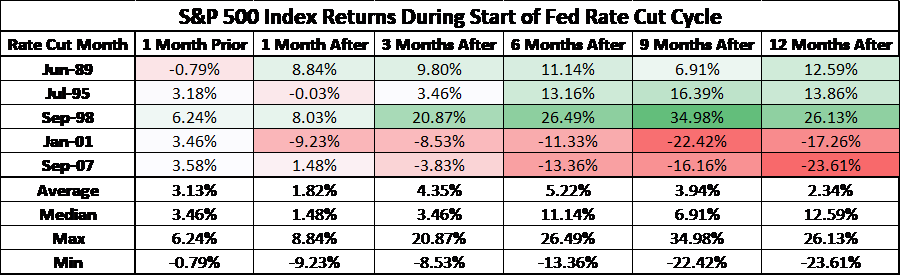
For the Fed rate cut cycles beginning July 1995, September 1998, January 2001 and September 2007, the S&P 500 Index posted positive returns of 3.18 percent, 6.24 percent, 3.46 percent and 3.58 percent respectively and is detailed above in chart 2. Although, the S&P 500 Index slid a mere -0.79 percent during the month prior to the start of the Fed rate cut cycle beginning June 1989.
STOCK MARKET PERFORMANCE WHEN THE FED BEGINS TO EASE MONETARY POLICY – CHART 3
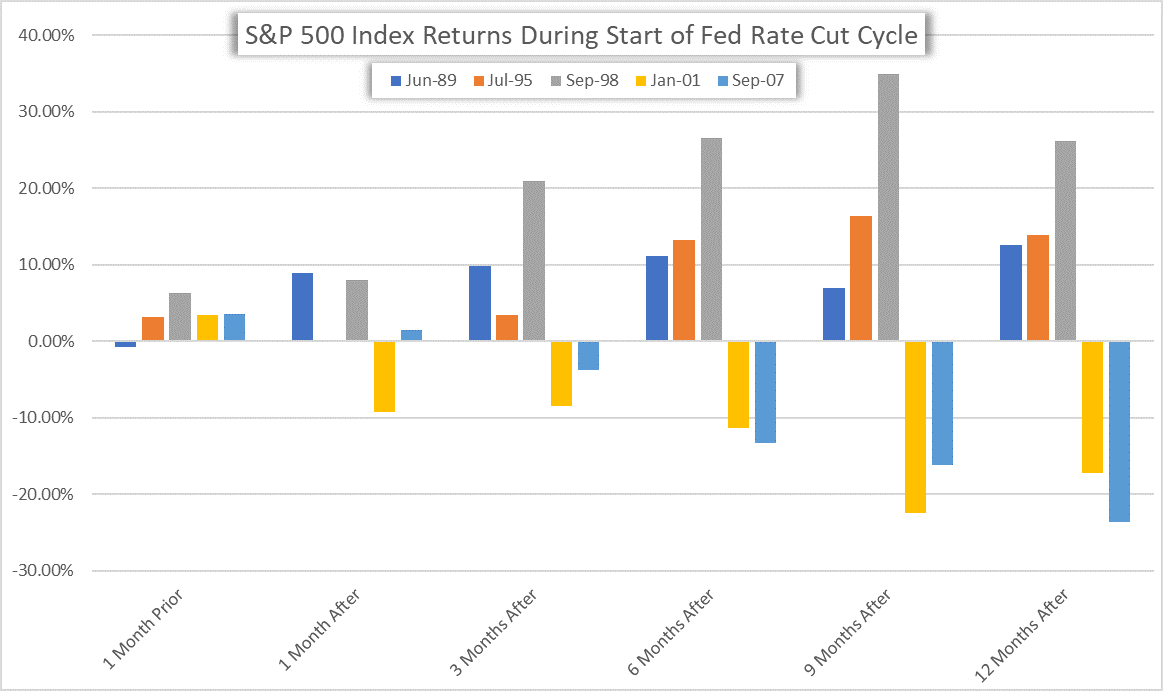
While the small sample set limits the ability to make statistical inferences, the variance of S&P 500 Index returns rises dramatically in the 3-months, 6-months, 9-months and 12-months following the start of a Fed rate cut cycle. Looking out a year after the FOMC begins to ease monetary policy, the S&P 500 Index was higher by 12.59 percent, 13.86 percent and 26.13 percent from June 1989, July 1995 and September 1998 whereas the stock market dropped -17.26 percent and -23.61 percent from January 2001 and September 2007.
HOW MIGHT STOCKS PERFORM IF THE FED CUTS RATES THIS YEAR?
It is worth pointing out that the previous Fed rate cut cycles came in response to patch up deflating asset bubbles like the 2001 internet bubble and 2007 housing bubble. Central banks have increasingly tested the limits of easing monetary policy with new unconventional tools such as quantitative easing.
As such, generally-strong equity returns in the month leading up to a Fed rate cut could be explained by the market’s hope that the Fed can step in to bolster investor confidence by saving declining asset prices and a slowing economy with looser financial conditions. Also, a reduction in the Fed rate increases the equity term premium and thereby boosts the relative attractiveness of stocks to bonds and other asset classes.
That being said, it is difficult to imagine that the already-diminishing impact of loosening monetary policy can overcome the daunting headwind posed by global trade friction, decelerating GDP and deteriorating equity earnings. If the macro-economy truly needs as much monetary stimulus as markets are currently pricing, investors could be in for a rude awakening when the longest business cycle in history officially comes to an end.
-- Written by Rich Dvorak, Junior Analyst for DailyFX.com
Connect with @RichDvorakFX on Twitter for real-time market insight