

EUR/USD Price Forecast, Analysis and Chart:
- EUR/USD moving sideways in a very-thin market.
- Traders should adopt a wait-and-see stance.

EUR/USD Outlook Muddled by Short- and Medium-Term Moving Averages
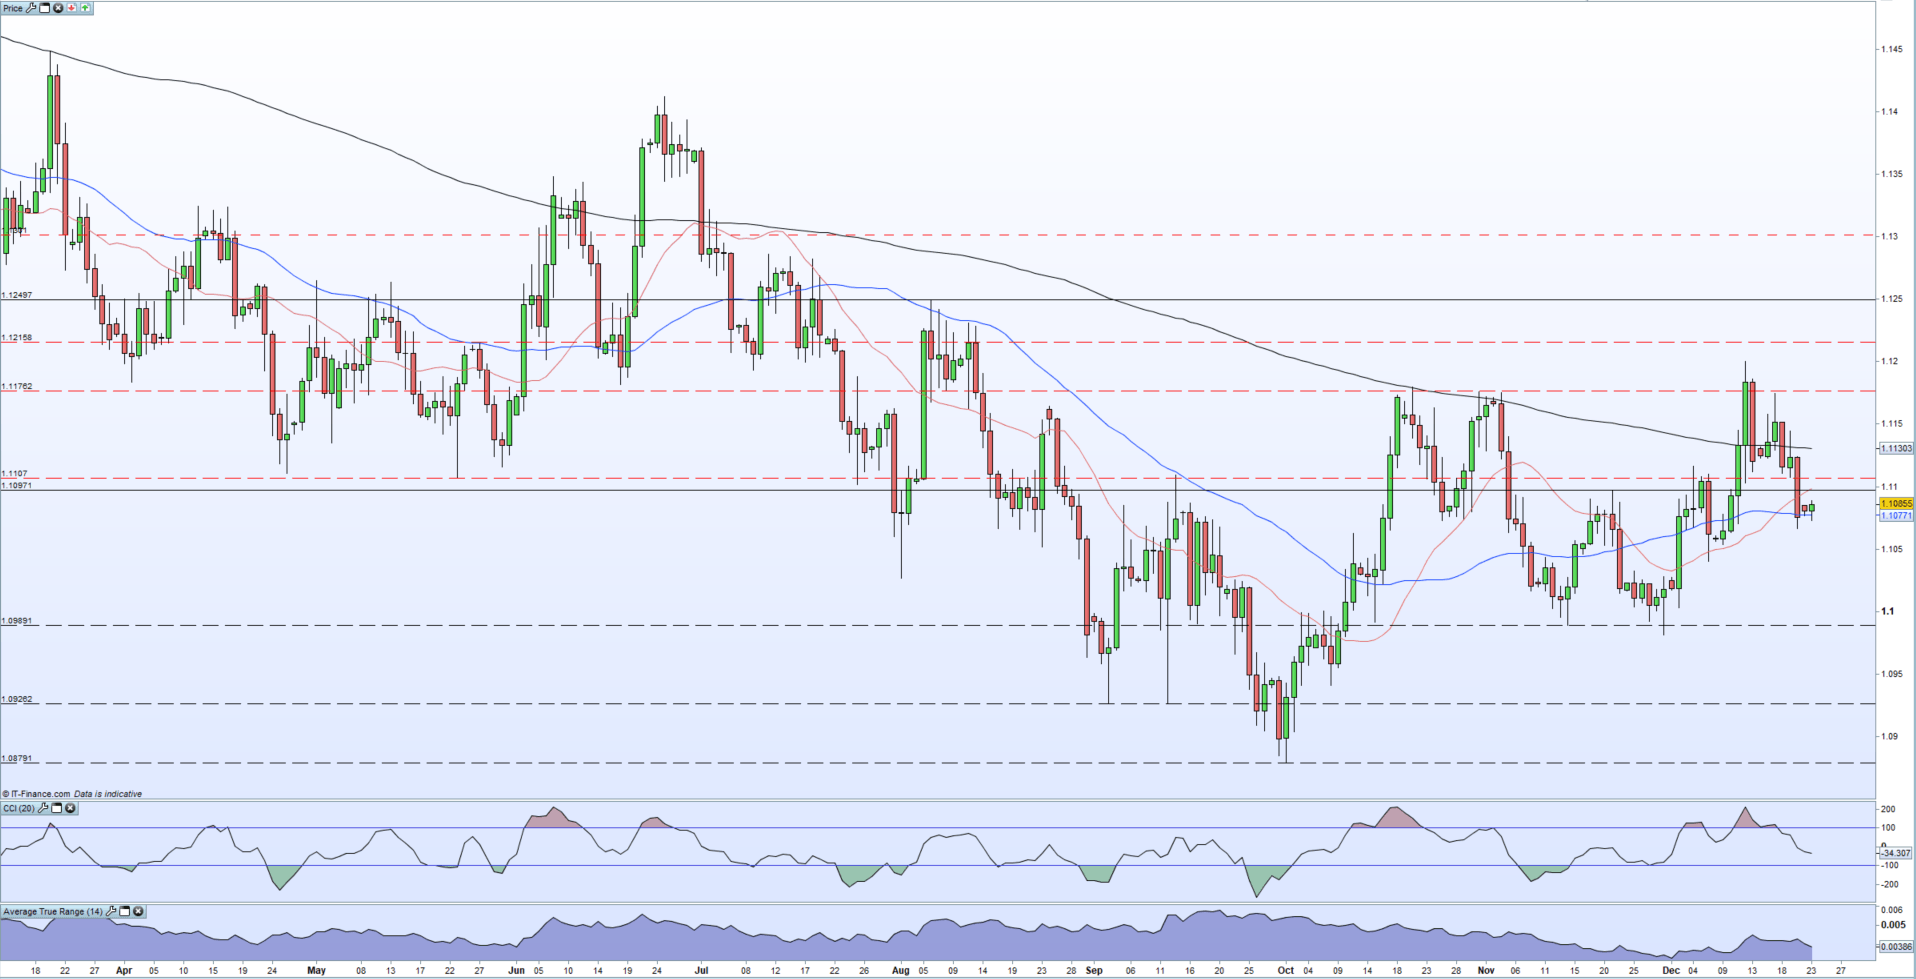
EUR/USD is struggling in holiday-thinned market conditions with the upside seemingly blocked by the 20-day moving average cutting across around 1.1100 big figure level. Last Friday’s slump through this indicator added a negative bias to the pair with this candle’s range of 1.1066 – 1.1124 likely to hold during the upcoming holiday. The downside is protected by the 50-dma at 1.1077 but this may come under pressure if US dollar strength continues into the year-end, leaving 1.1066 vulnerable. Holiday-thinned markets can prove tricky and it may be best to watch any moves from the sidelines until liquidity returns.
EUR/USD Technical Analysis – Euro Struggling to Break Higher
Thin market conditions may help a downside break, especially as the US dollar remains in demand going into the year-end. While the latest CoT Report shows some USD longs being pared back, the Fed remains concerned about USD liquidity and recently announced that it will provide $500 billion of liquidity via overnight and term repos. The Federal Reserve Bank of New York announced last week a supply of reserves ‘to mitigate the risk of money market pressures that could adversely affect policy implementation’.
Economic data out later in the session includes US durable goods orders for November which are expected to pick-up to 1.5% from October’s 0.5%. For all economic data and events, see the DailyFX Economic Calendar.
EUR/USD Daily Price Chart (March – December 23, 2019)
| Change in | Longs | Shorts | OI |
| Daily | -9% | 5% | -1% |
| Weekly | -35% | 54% | 3% |
Traders may be interested in two of our trading guides – Traits of Successful Traders and Top Trading Lessons – while technical analysts are likely to be interested in our latest Elliott Wave Guide.
What is your view on the Euro and the US Dollar – bullish or bearish?? You can let us know via the form at the end of this piece or you can contact the author at nicholas.cawley@ig.com or via Twitter @nickcawley1.