
Dow Jones, Nasdaq 100 Forecast:
- An abrupt surge in volatility sent the Dow Jones and Nasdaq retreating from record levels
- The possibility of steep declines was something I highlighted in this week’s equity webinar as price action and fundamentals seem to tell divergent stories
- Other markets have also exhibited price action that may suggest further volatility is in store
Dow Jones & Nasdaq 100 Drop as Volatility Spikes, Will Support Hold?
Stocks experienced an abrupt uptick in volatility on Thursday as the S&P 500, Nasdaq 100 and Dow Jones fell to their respective support levels nearby. While buyers returned quickly to stem the bleeding, the initial move saw stocks threaten nearby noteworthy support in - what was effectively - a single motion. The ability for price to fall so precipitously and so abruptly while trading near record highs, devoid of an obvious catalyst, suggests fragility and could leave the door open to further declines of a similar nature.
Nasdaq 100 Price Chart: 1 – Hour Time Frame (January – February)

Looking elsewhere, hints of risk aversion are rampant. First and foremost, gold has staged an incredible multiday rally that has seen the precious metal and safe haven asset climb to the highest levels since 2013 – and a continuation higher seems likely.
Gold Price Chart: 1 – Hour Time Frame (January – February)

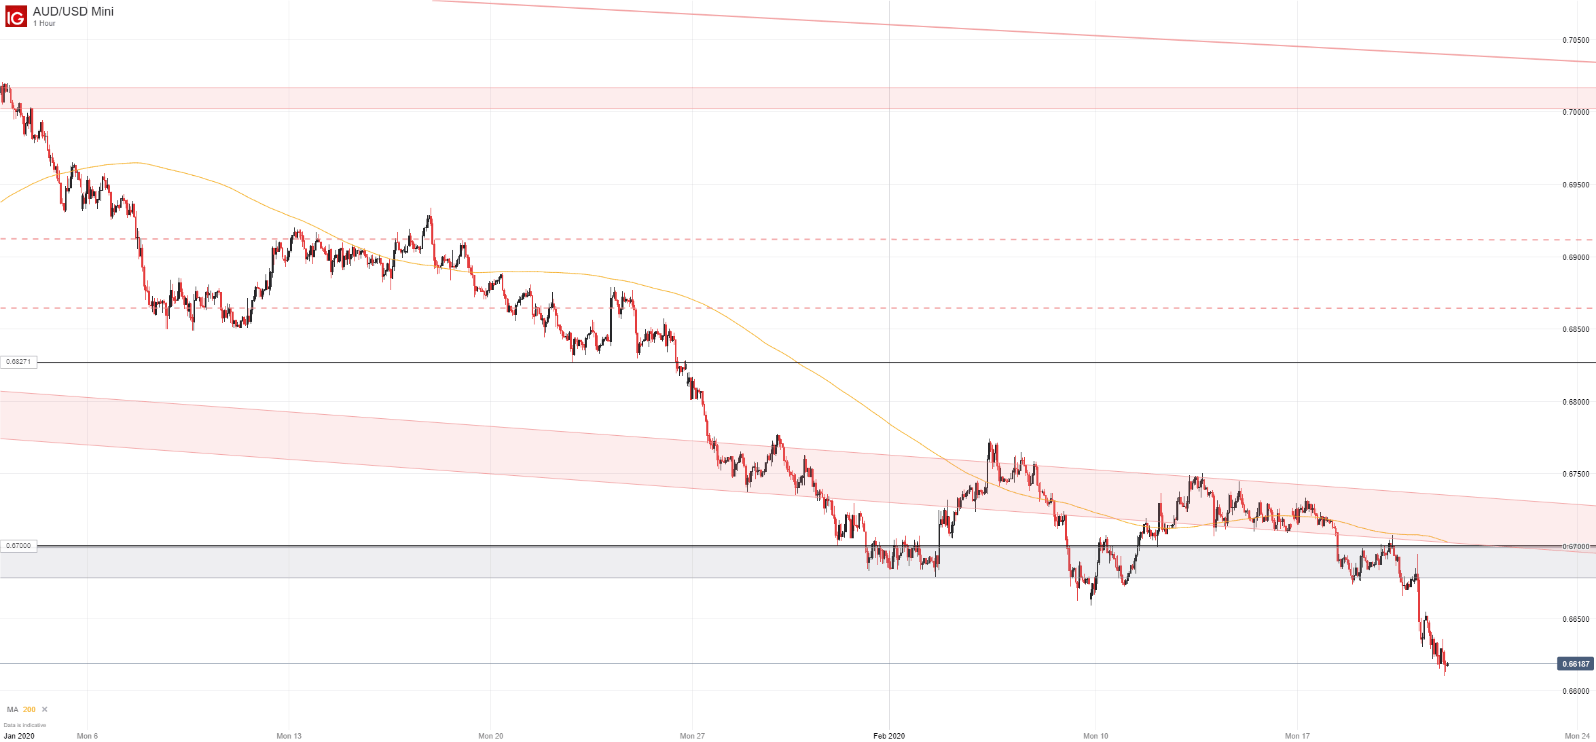
Secondly, the export-driven Australian Dollar suffered a substantial breakdown versus the US Dollar earlier Thursday, breaking through longstanding support and moving beneath decade lows.
AUDUSD Price Chart: 1 – Hour Time Frame (January – February)
While the stock and foreign exchange markets have sounded off, so too has the bond market as the 3-month, 10-year yield curve (3m10s) suffered its deepest inversion since October. Widely watched by traders, the 3m10s can be a key predictor of a looming recession should it remain inverted for a full quarter. Nevertheless, falling yields highlight a surge in bond-buying which may suggest investors are looking for safety.
US 3-Month and 10-Year Yield Curve

That being said, the current bull run has proved resilient and a brief spike in volatility does not necessarily require follow through. Given the broader fundamental backdrop and price action in other markets however, it seems as though further volatility may be in store in the days and weeks to come. In the meantime, follow @PeterHanksFX on Twitter for updates and analysis on the stock market.
--Written by Peter Hanks, Junior Analyst for DailyFX.com
Contact and follow Peter on Twitter @PeterHanksFX